
Nordea Asset Management
ESG Data Platform Prototype
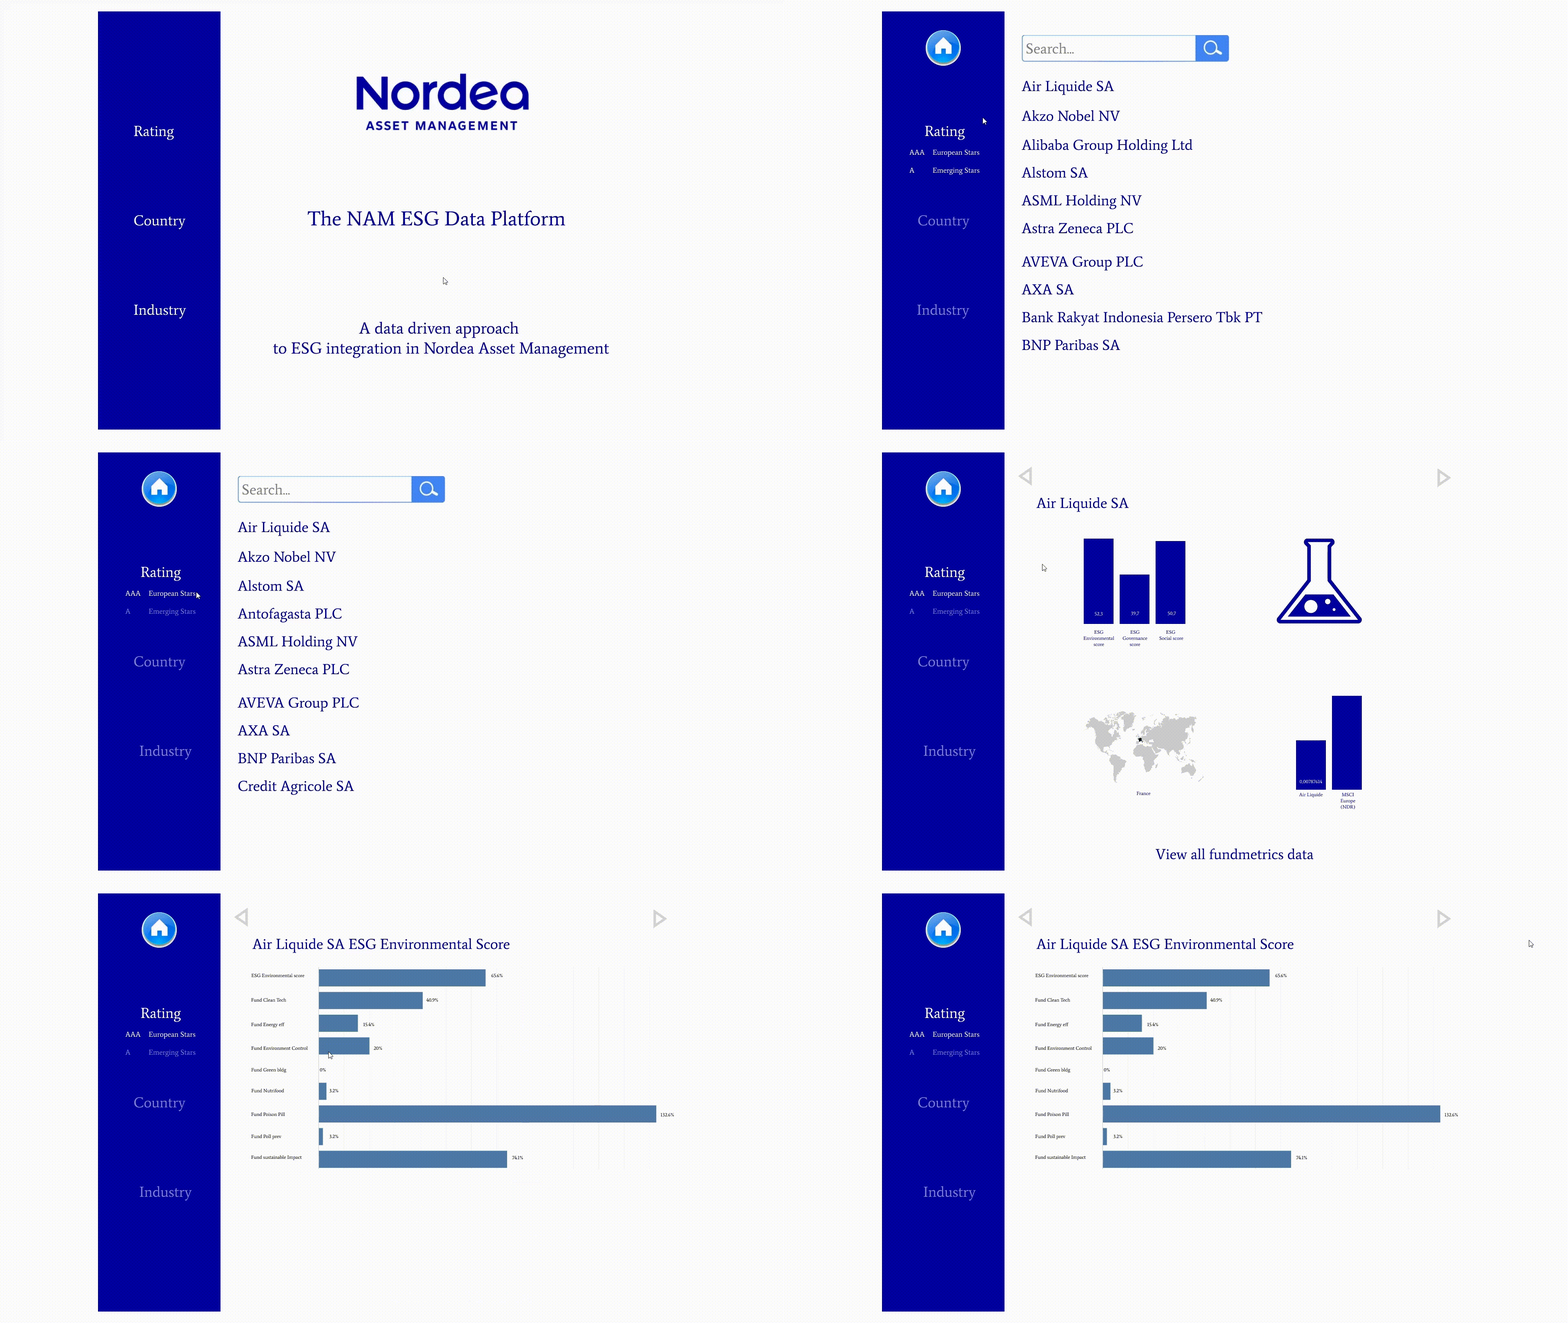
My study group worked together with Nordea Asset Management (NAM) on creating a functional prototype of the company’s ESG risk data tool. Our goal was to design a functional and manageable prototype with a frontend and backend that was geared towards Nordea Asset Management’s target users, such as portfolio managers. We had a month to create the prototype and present it to Nordea.
I was primarily in charge of designing and presenting the frontend of the high-fidelity prototype to Nordea’s executives.
Goal
Background
As the largest asset manager in the Nordics, Nordea aims at expanding NAM in European businesses. They offer investment solutions that enable their clients to navigate diverse marketing conditions. An element within all such investment processes involves analyzing Environmental, Social, and Governance (henceforth ESG) data. ESG data refers to the three key criteria in evaluating the sustainability, ethical impact, and associated potential financial performance of a company. With growing alertness and demand for climate action amongst consumers, adopting ESG measures is now considered more important than ever for businesses of all sizes to thrive in the present and future.
NAM aims at centralizing its ESG data efforts around their ESG data platform made up of an ecosystem of interconnected ESG analytics modules and a user interface. Because NAM does not have a tradition to build in-house visualization tools for user-centric experiences, their data is instead integrated by programmers to other programmers. This makes it harder for NAM’s end-users such as portfolio managers and risk data analysts to navigate through all the data and find the valuable ESG information they need.
We assessed our design solution with Nordea Asset Management during our presentation. Nordea’s representative was very satisfied with the prototype but wondered how our prototype could be integrated with risk management. A risk data analyst would want to get immediate info on which ESG factor of a specific company is at risk. This can be done by coding an “alarm” that triggers if a specific ESG rating is way above or below the average.
Findings
Prototype and workspace
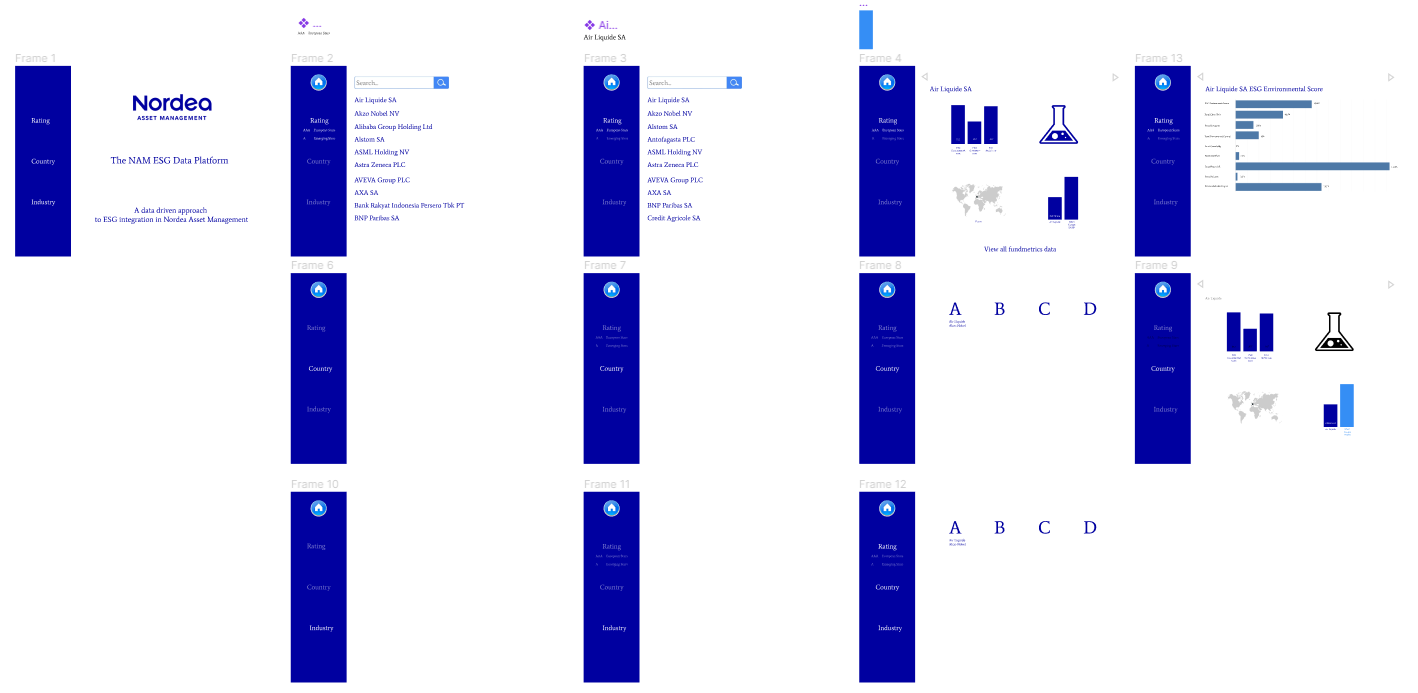
The final solution is a high-fidelity prototype consisting of a front- and backend, aiming to be simple, intuitive and expressive Entering the platform, users are presented with the several options on the left. Depending on how or based on what aspects users intend to look for a specific companies’ ESG data, they are presented with three options: Rating based, Country based and Industry based.
The ratings based option is based on the MSCI ESG rating standard, depicted as “AAA” and “A”. These ratings were present as a categorization of companies’ ESG rating in the data received from NAM. The Country and Industry based options, though not implemented as of now, would allow end users to analyze companies ESG scores and compare to how they perform to other companies in the country or related industry sector.
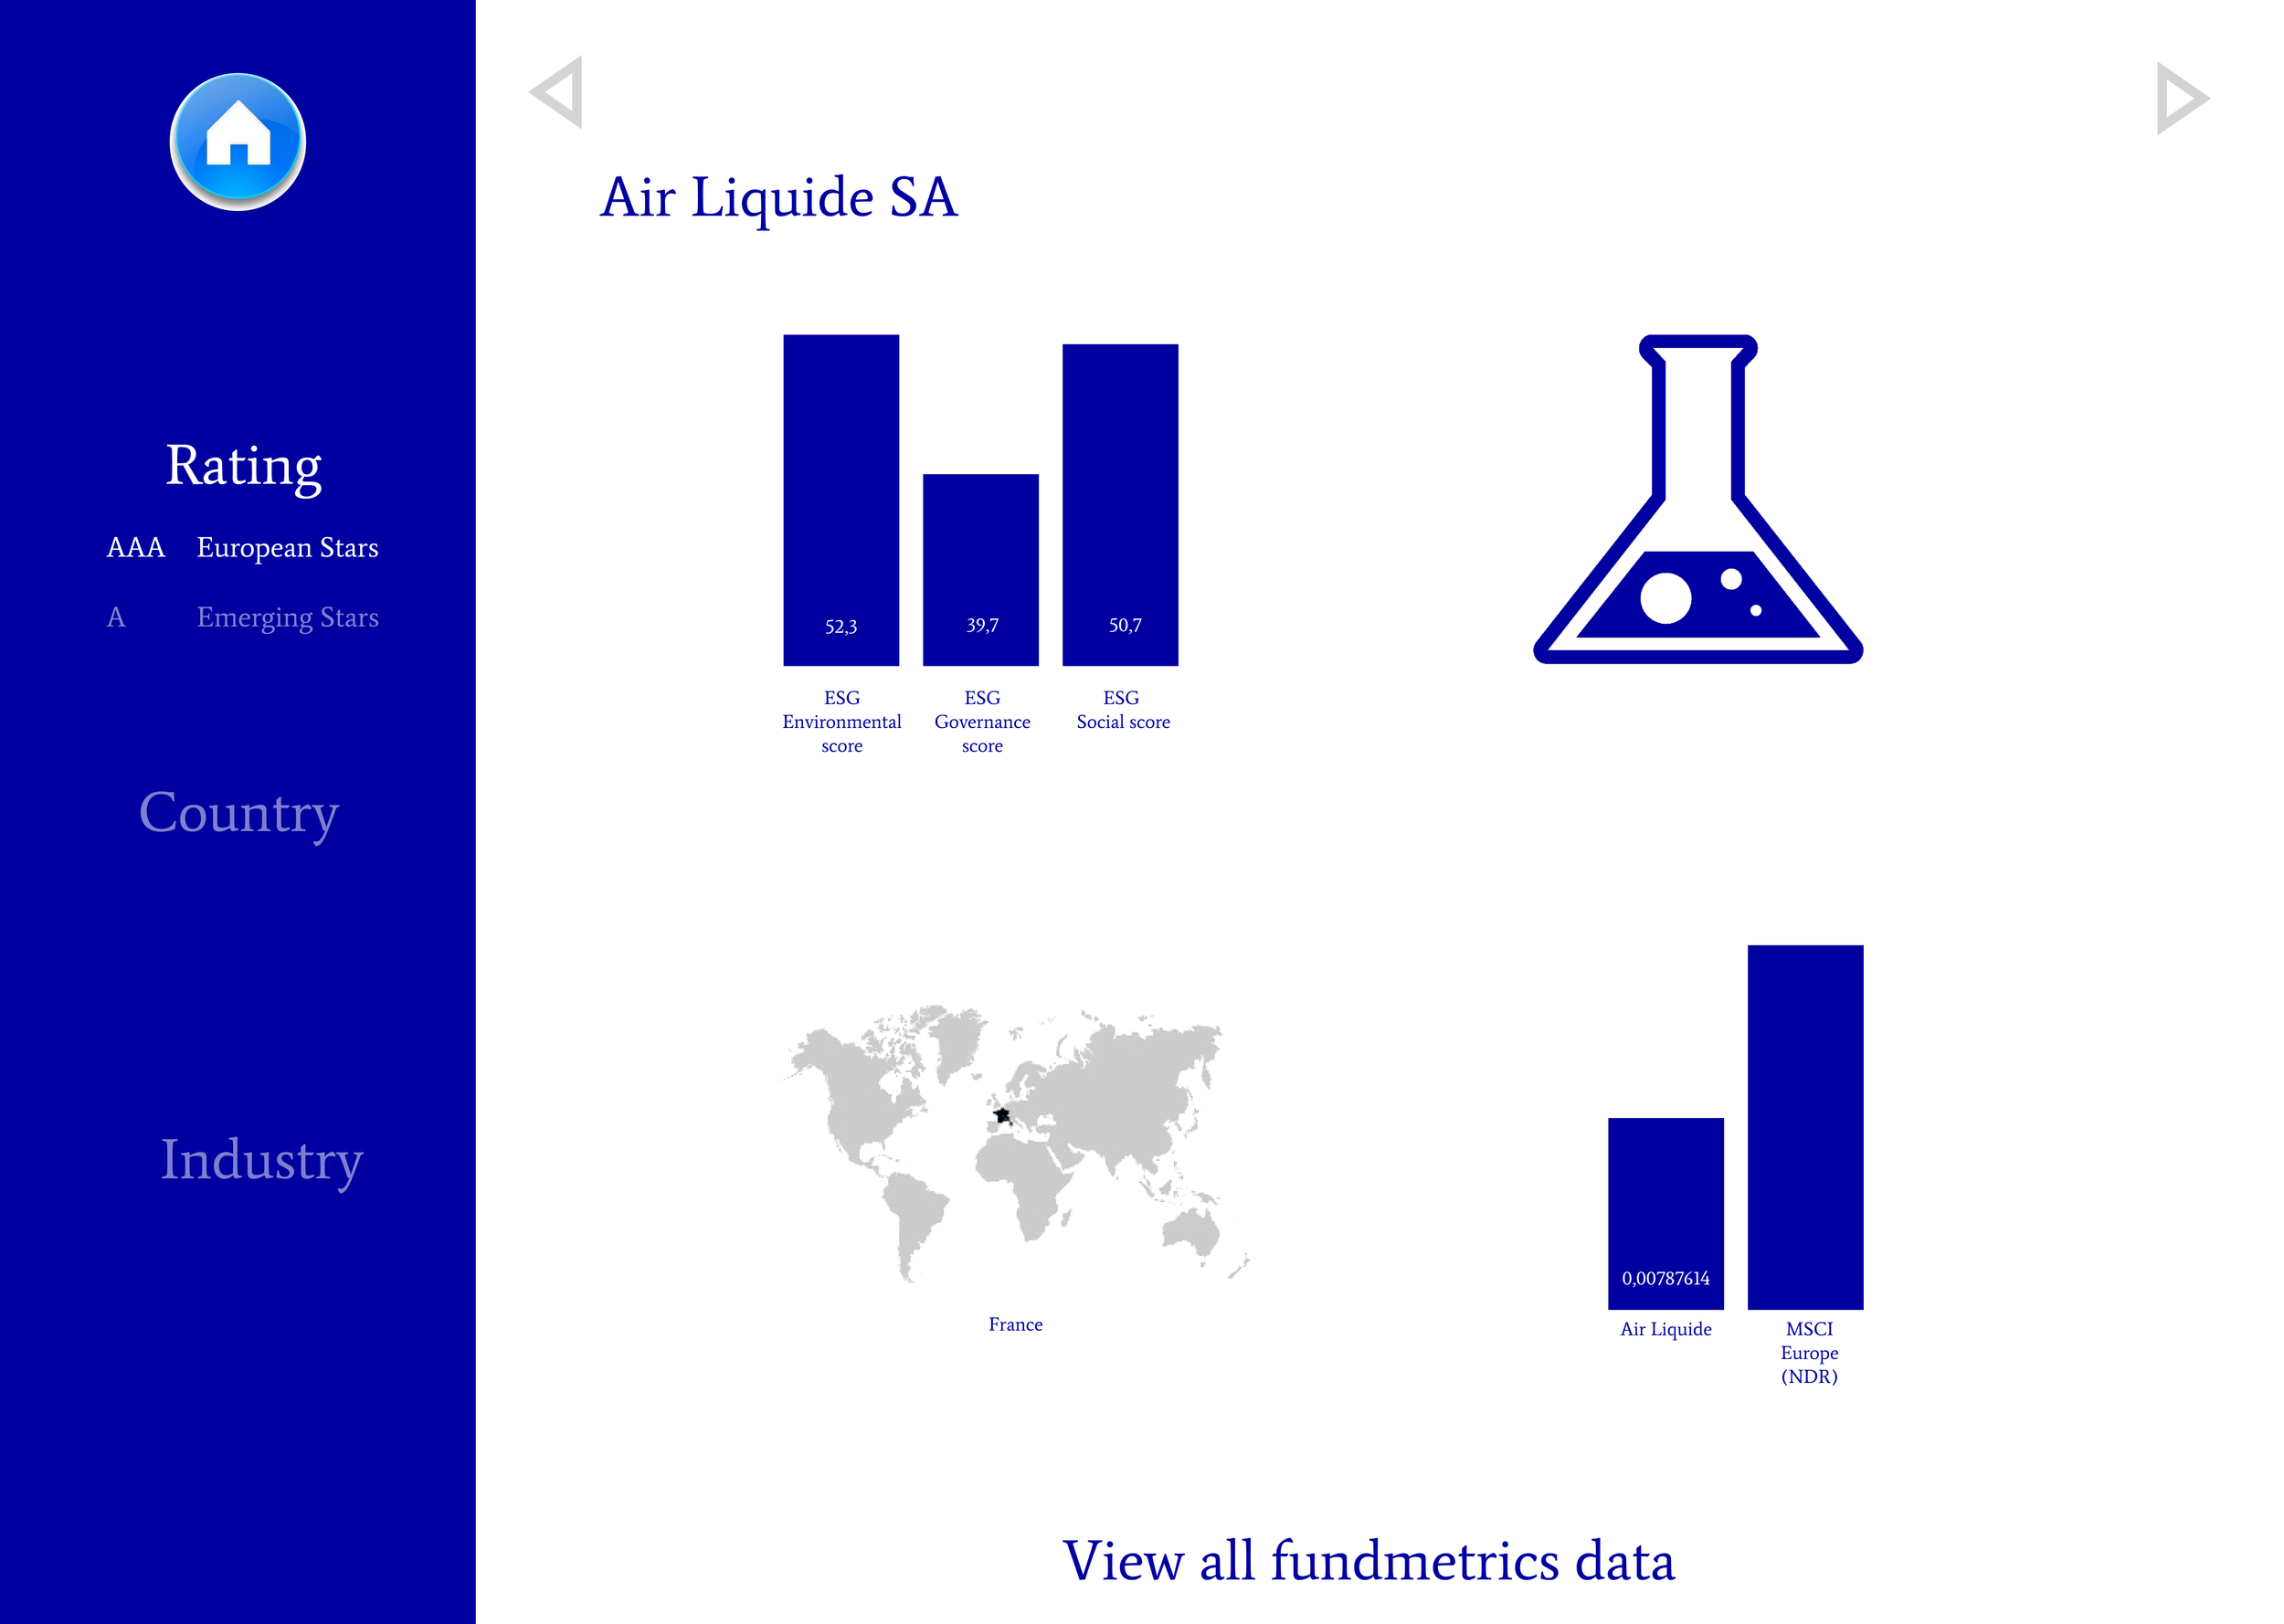
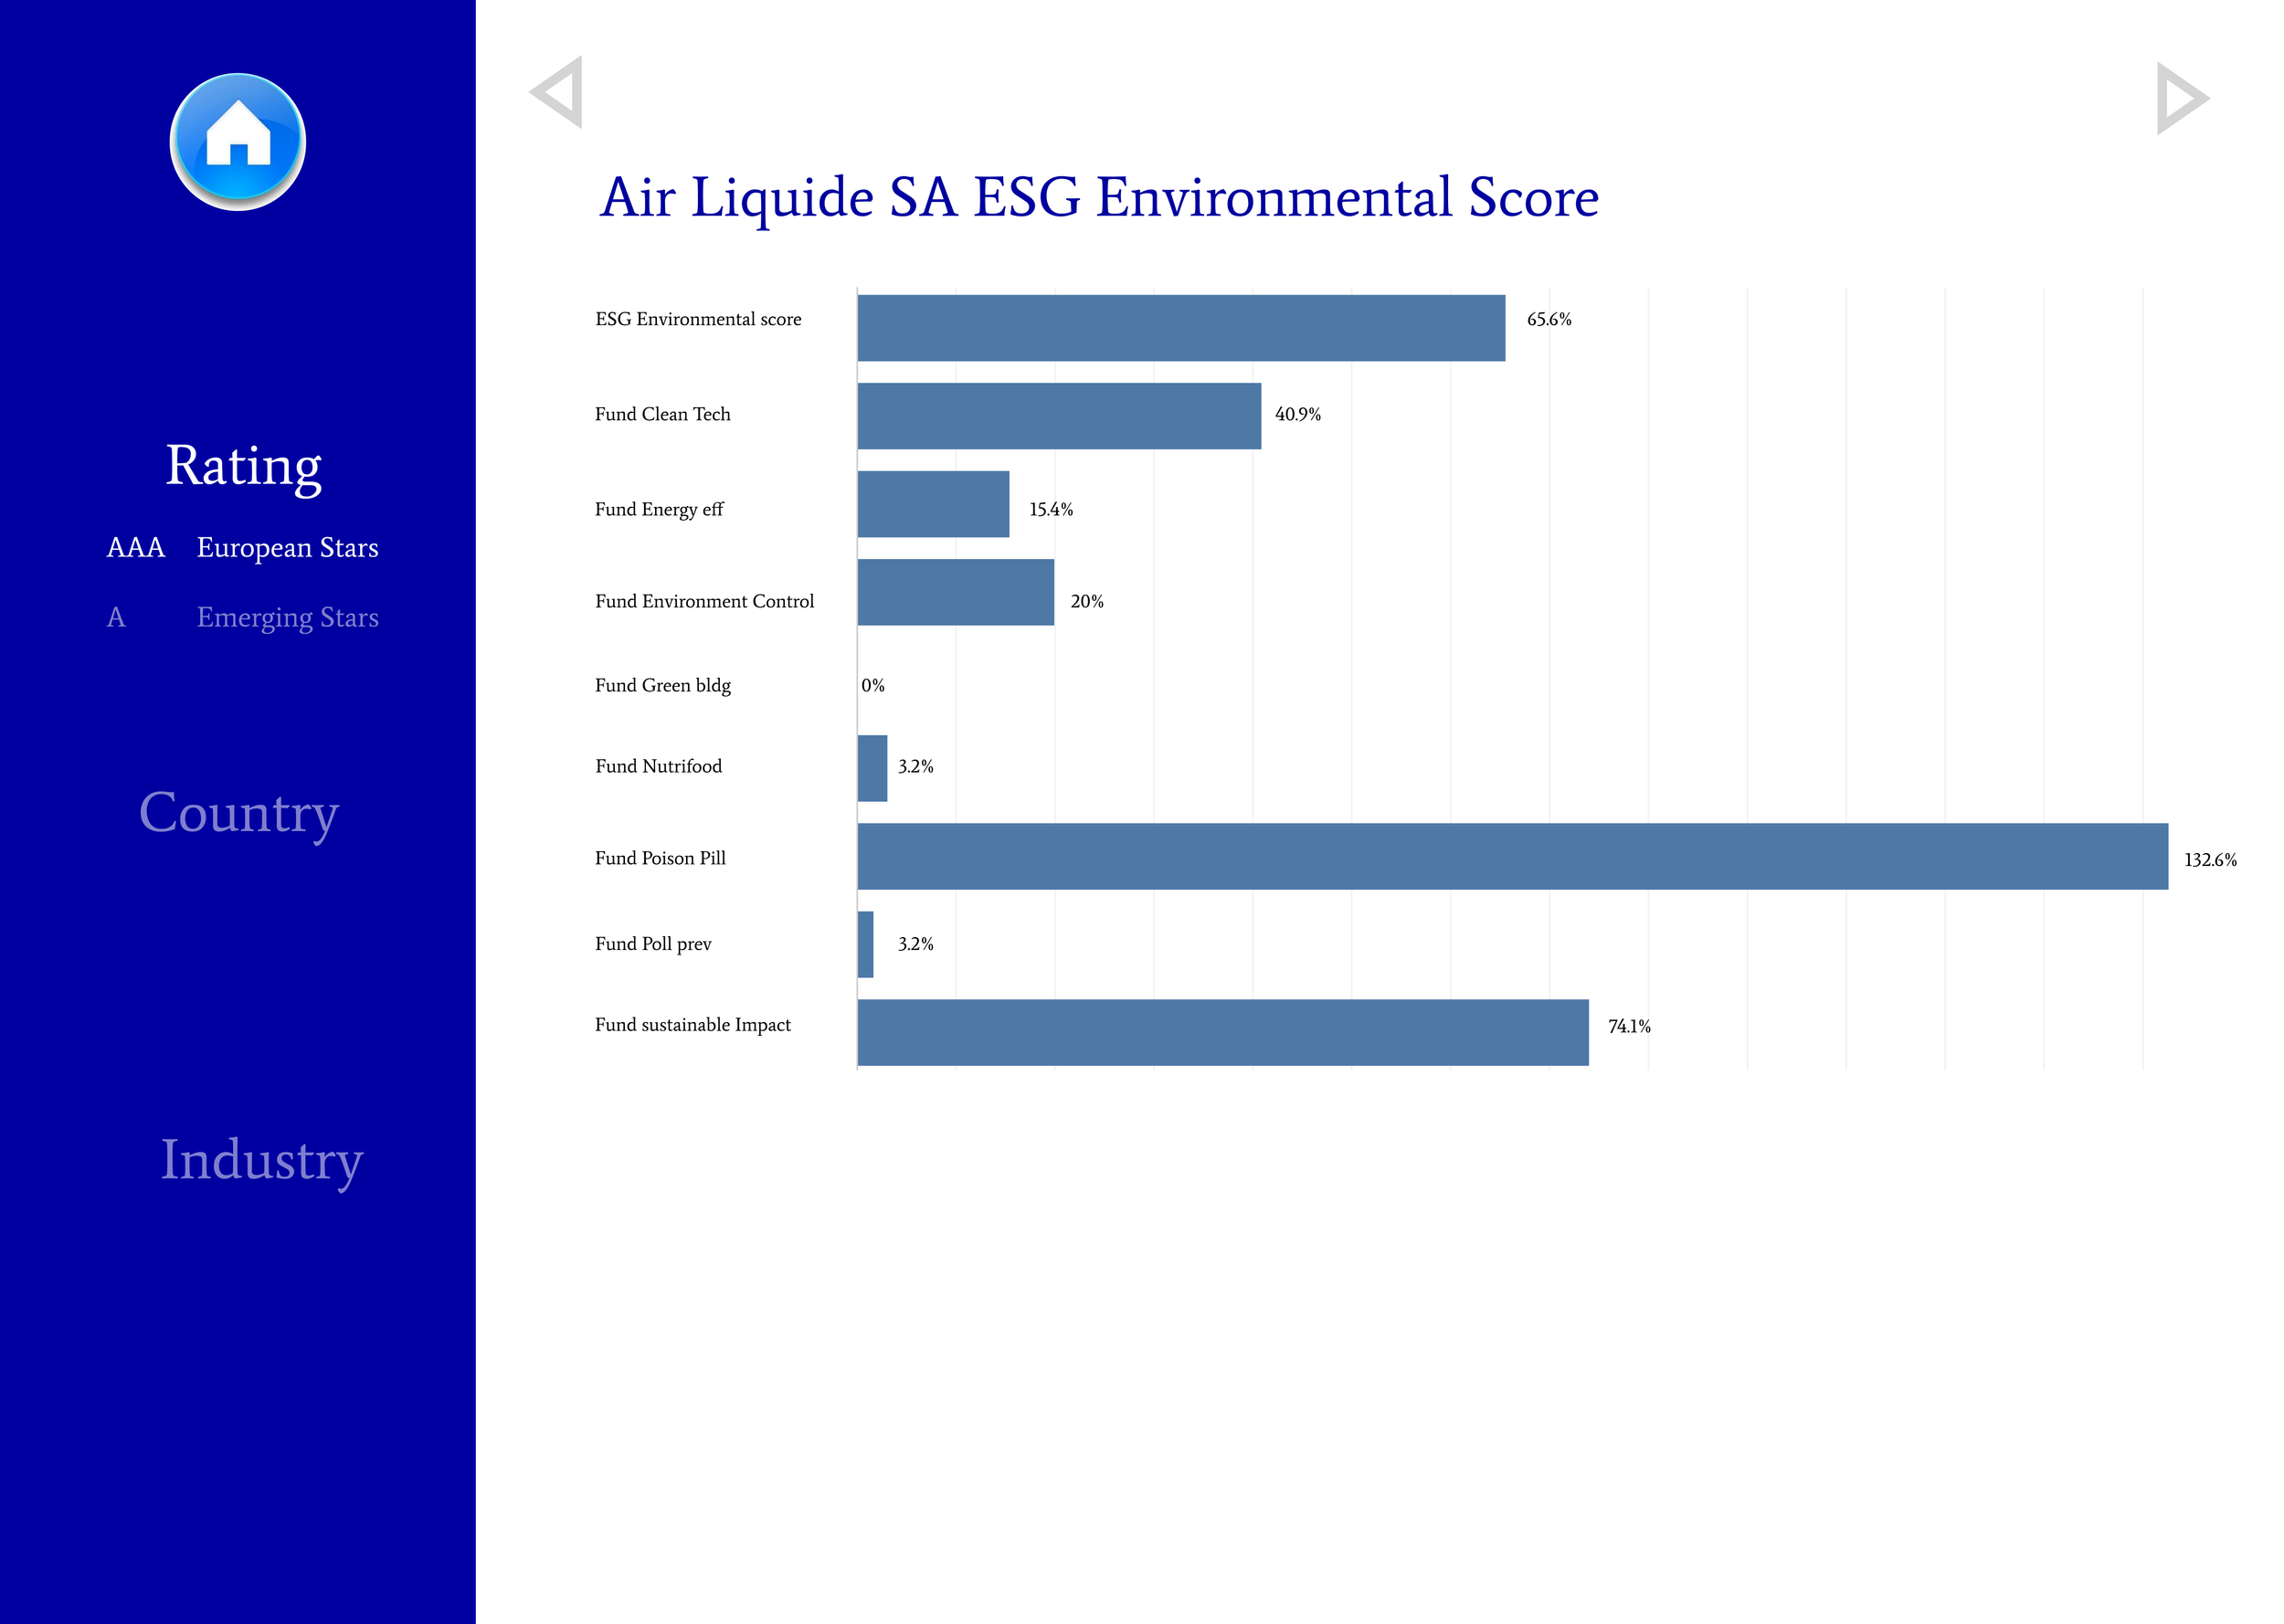
Navigating into any of these three options, a list of companies is presented relative to the option chosen, along with a search bar for ease of access. Upon finding the company the user was looking for, the user is presented with a visualization of the ESG data.
Our proposed solution creates value for NAM by improving the end users work in increasing their effectiveness. The effectiveness comes with the solution being set in having a user-centric UI. This focus increases the user’s interaction with ESG data, as it makes it easier and more digestible for the ie. portfolio manager to work with vast amounts of complex ESG data, without risking loss of valuable information.
Future work
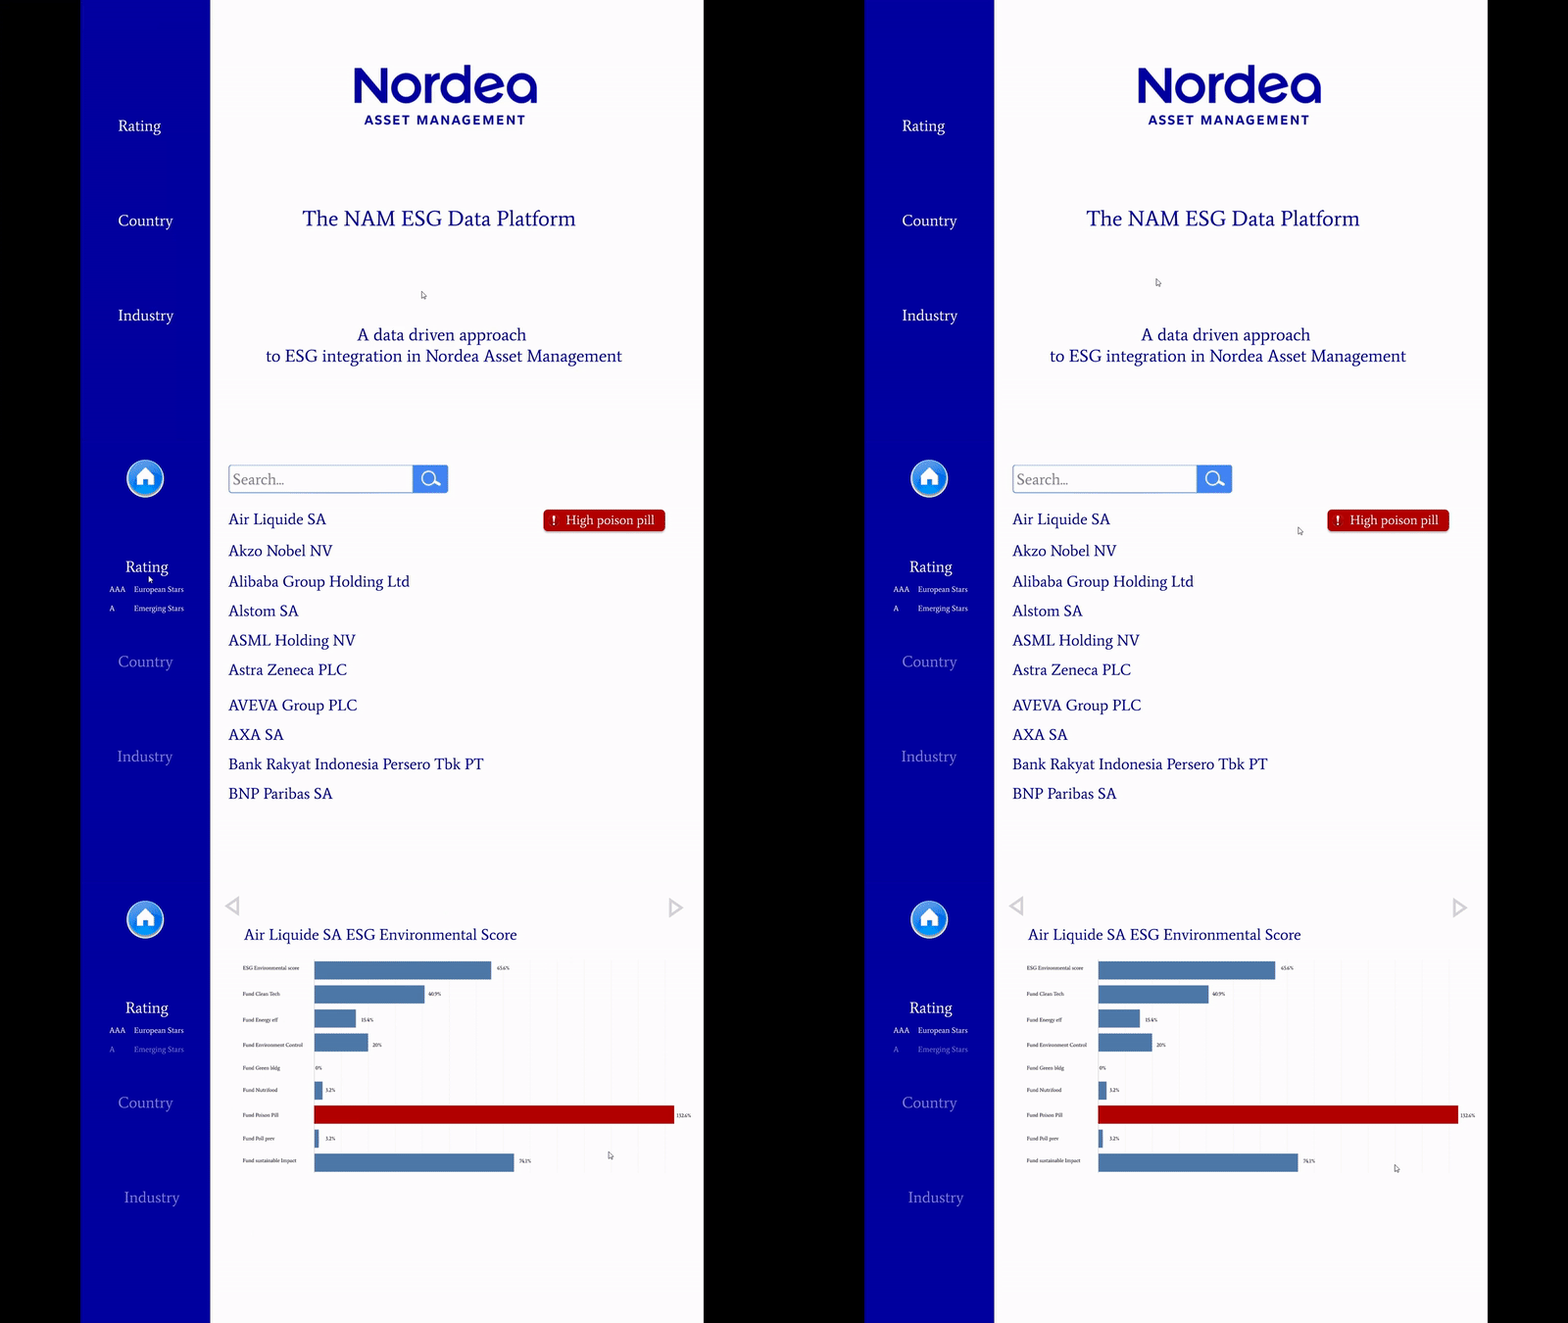
A risk data analyst would want to get immediate info on which ESG factor of a specific company is at risk. This can be done by coding an “alarm” that triggers if a specific ESG rating is way below (or in other cases above) the average score. Implementing this requires more advanced coding, e.g., an alarm in case the poison pollution rating of a specific chemical company is too high compared to the benchmark. A way to achieve this would be to calculate the average of filtered factors such as “chemical companies”, or “chemical AAA companies”, to be more specific. These calculations could be implemented in a possible future iteration of the prototype.