
Statistics Denmark:
Improving UX for
Business Data Collection
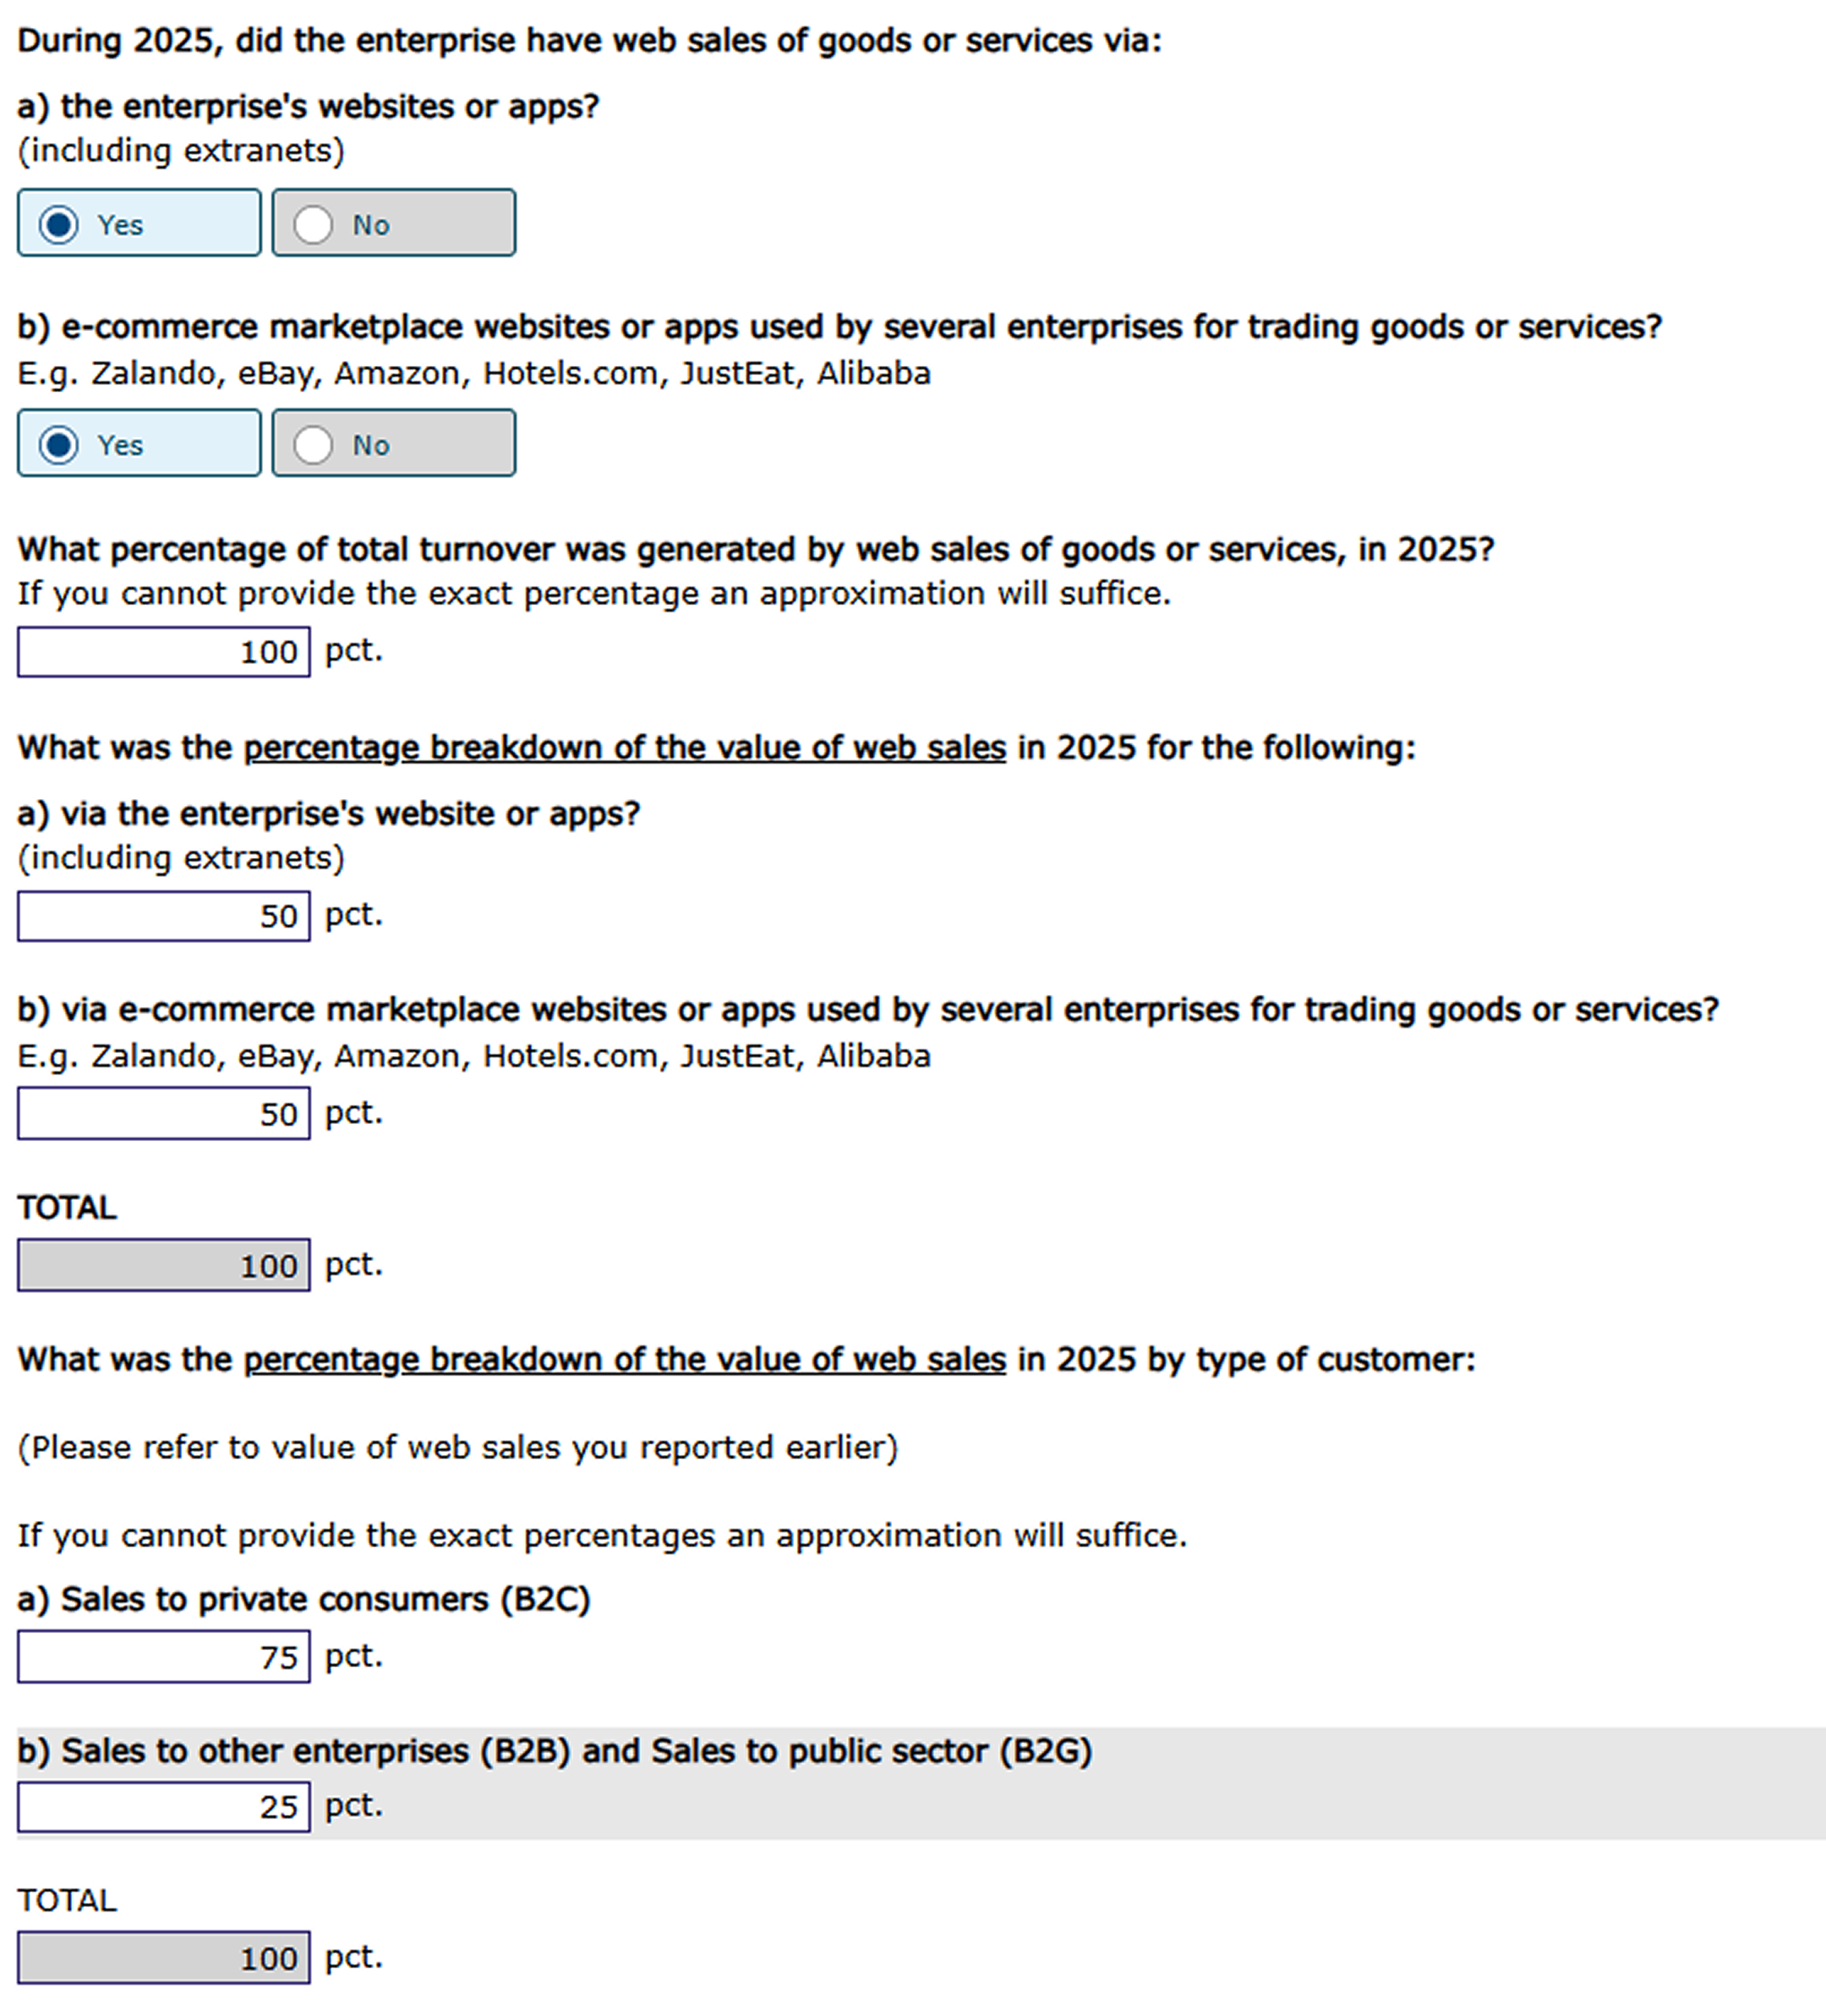
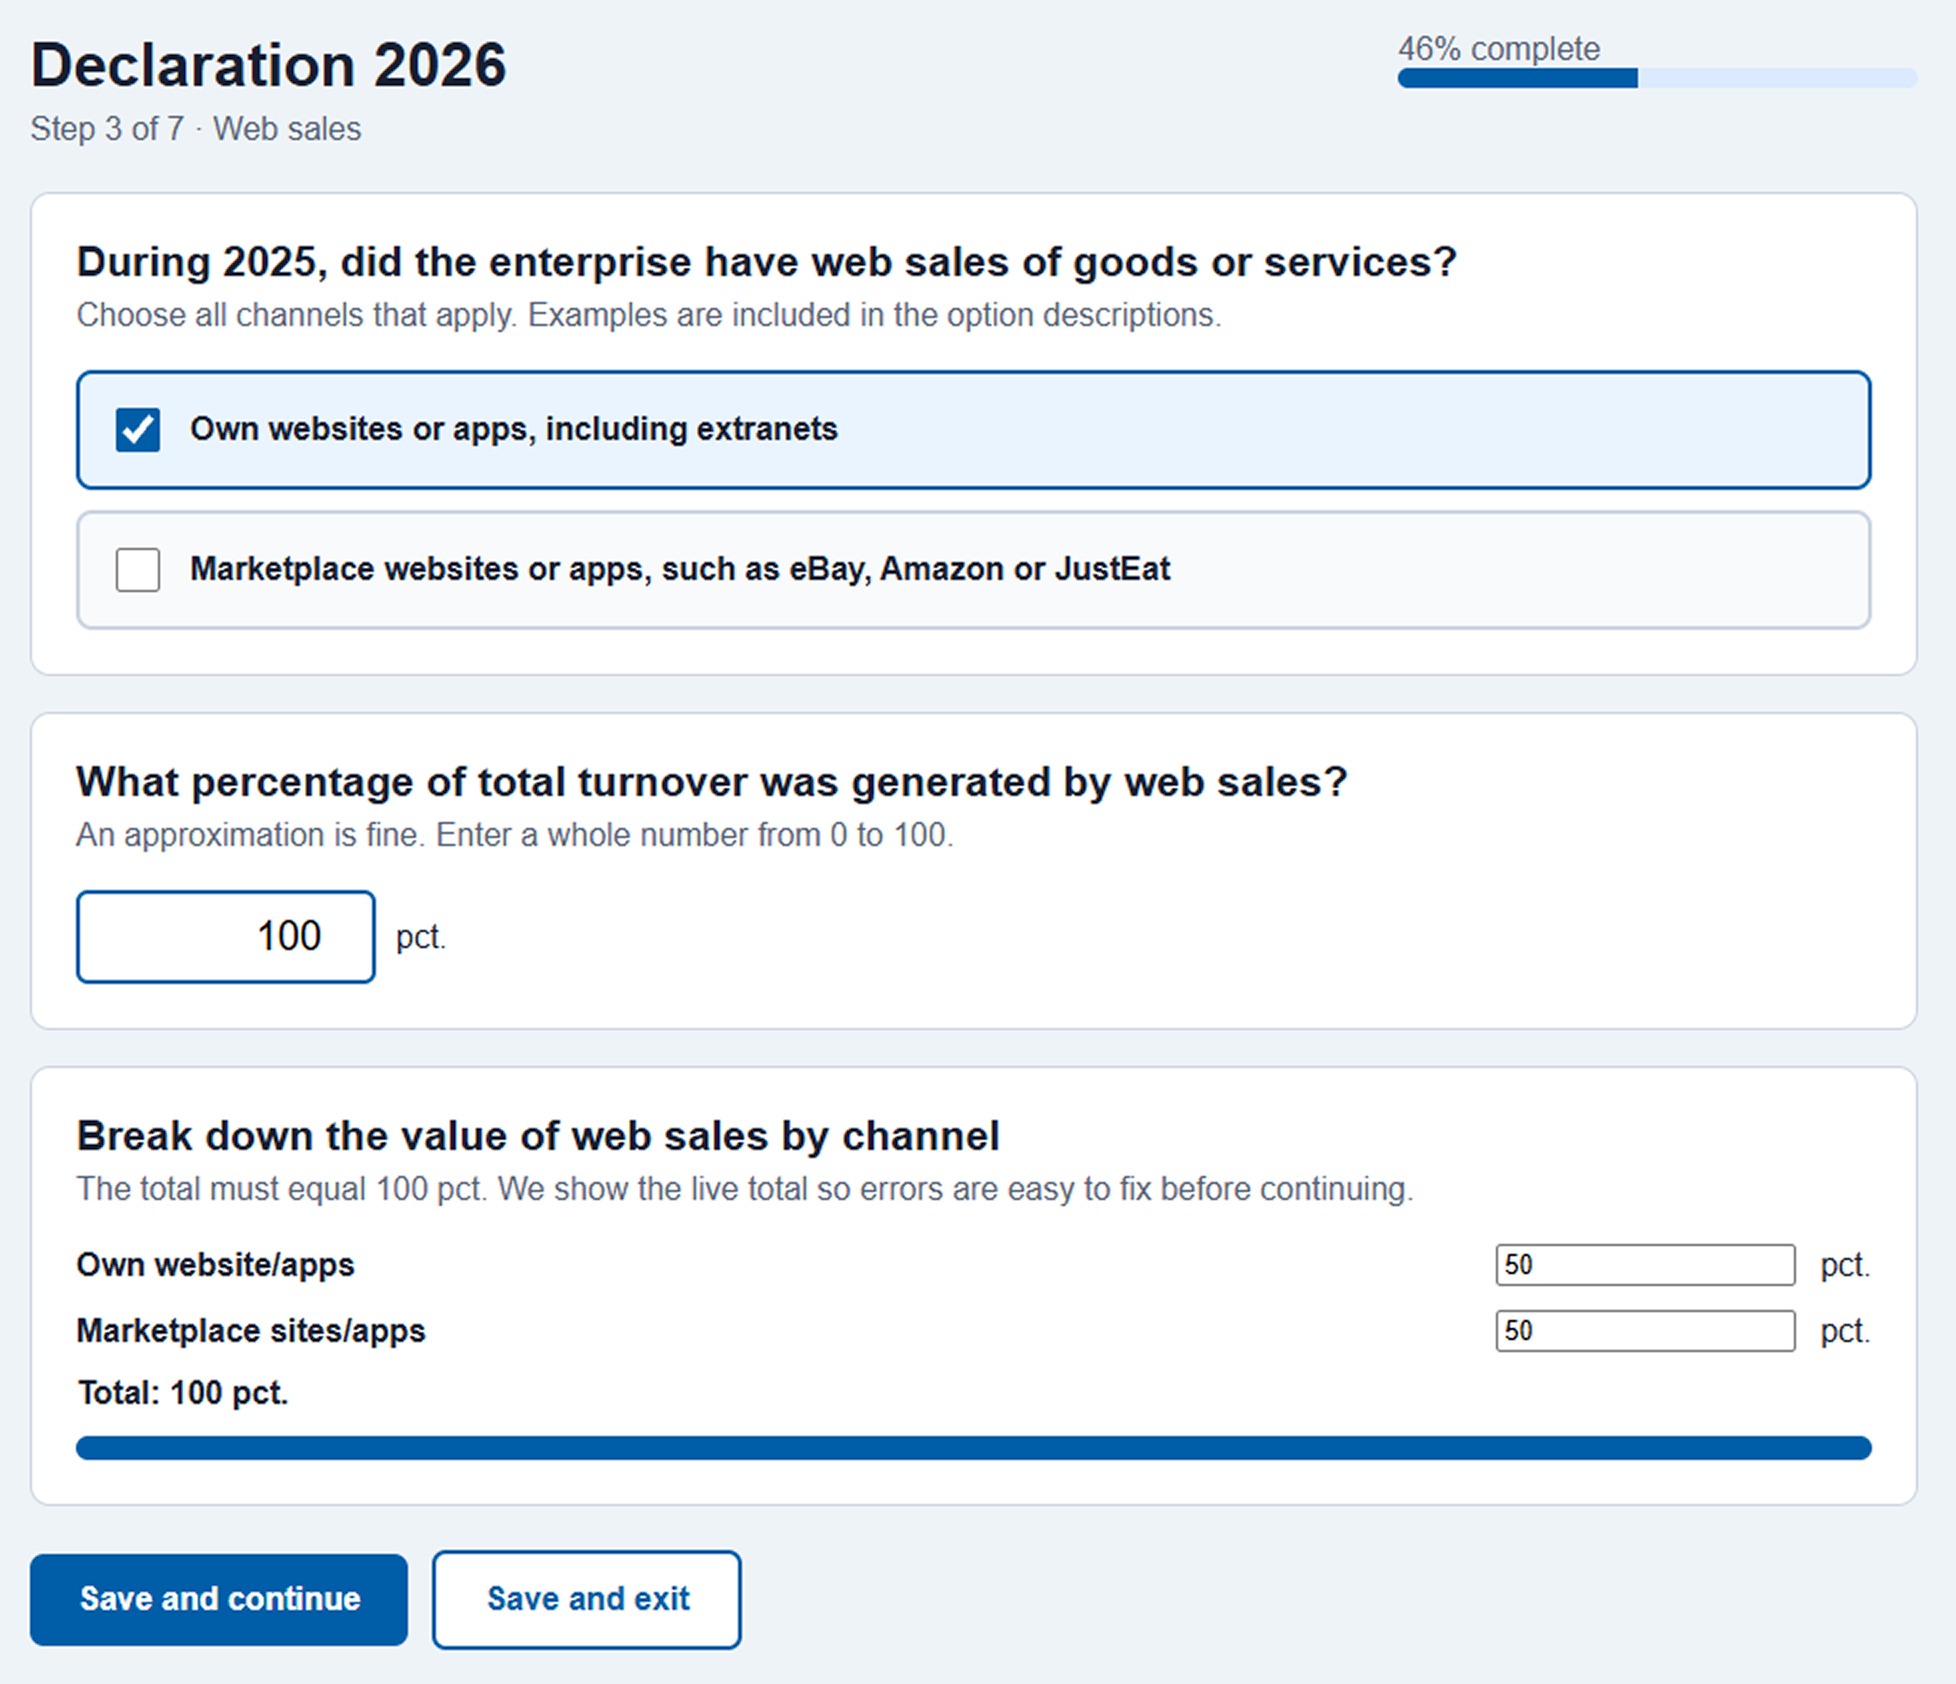
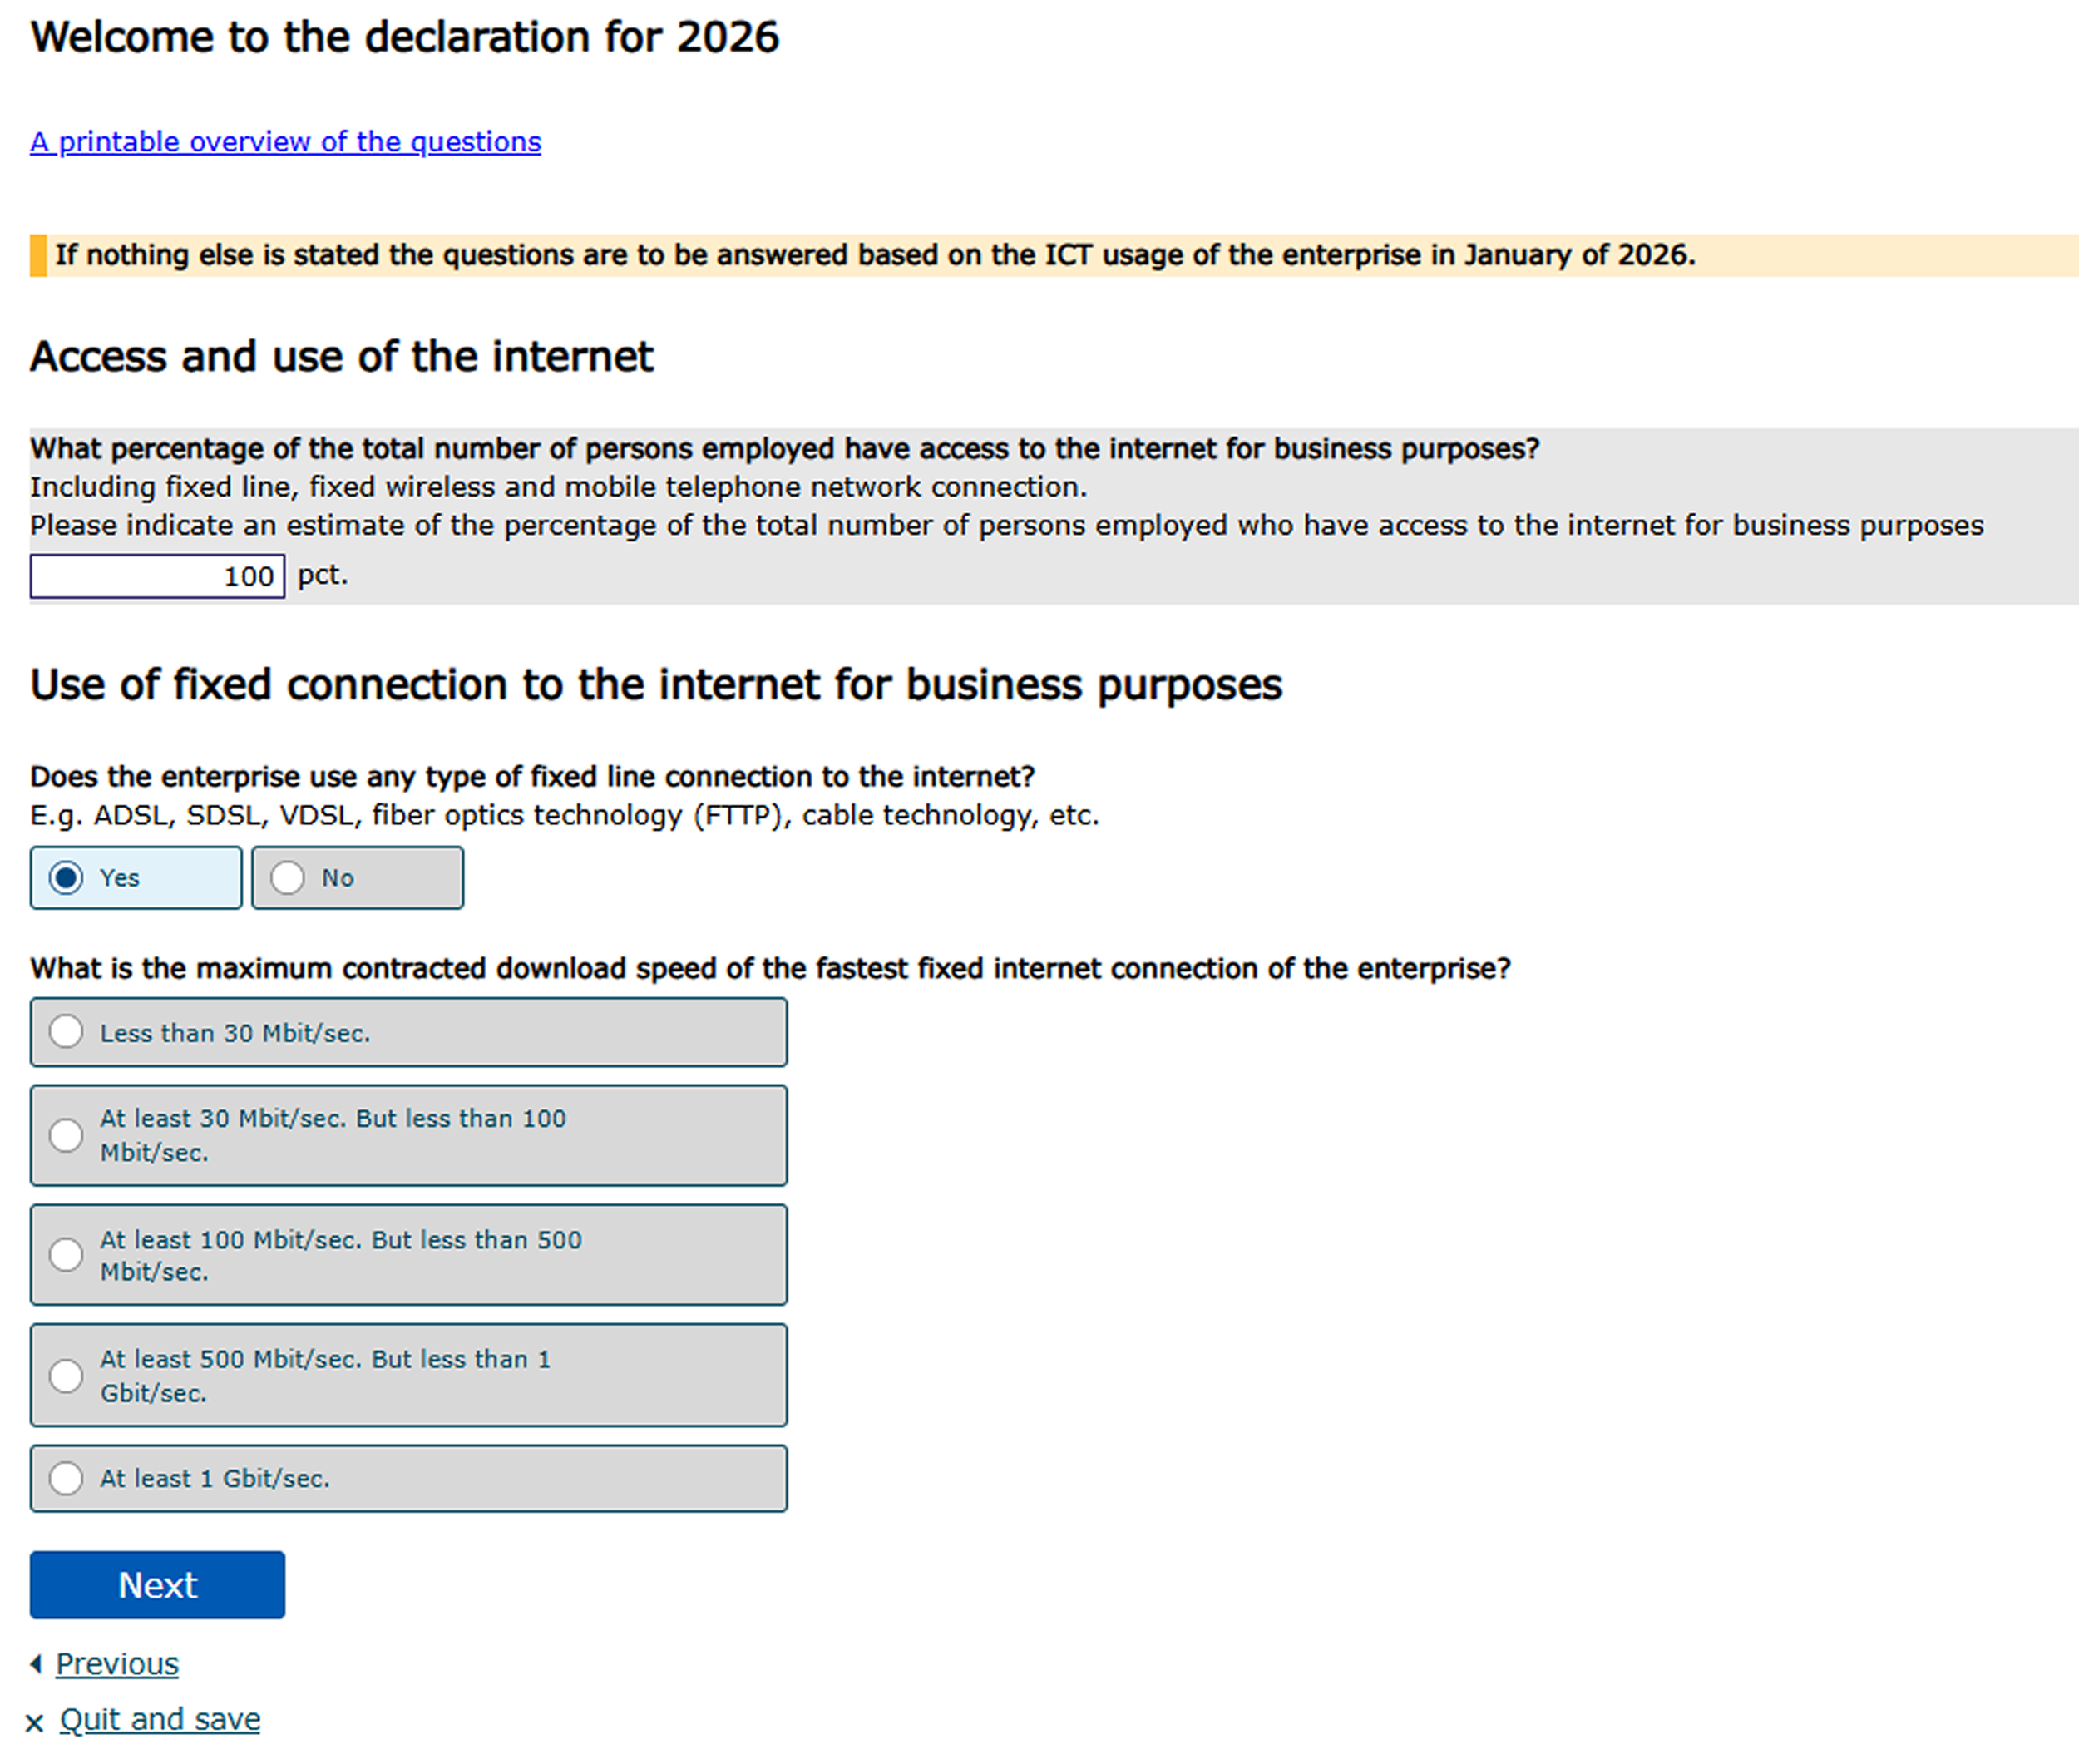
The aim is to move from a single long, visually flat form to a guided questionnaire system: one task per screen, clearer question hierarchy, progressive disclosure, live validation for percentage totals and larger touch targets on radio buttons.
Background
Business Data Collection refers to data on Danish enterprises and Danish trade and industry. Business data from Statistics Denmark covers a wide range of data on industries and data on the size, location, accounts, employment, development over time, etc. of Danish enterprises.
EU legislation requires all EU Member States to produce official business statistics. Danish legislation authorizes Statistics Denmark to collect the information necessary from businesses in order to compile these legally mandated statistics. Consequently, businesses are legally required to report the information we request regarding their activities, purchases, sales, prices, employees, wages, and other relevant data.
Target Audience
In 2025, approximately 12% of Denmark’s roughly 420,000 active private enterprises were subject to mandatory reporting requirements to Statistics Denmark.
In practice, businesses are selected for mandatory reporting based on factors such as their size, industry, and other relevant criteria. The smallest businesses are required to report the least, while the largest businesses report the most. We collect data from as few businesses as possible while ensuring that the statistics adequately cover all industries and types of enterprises.
We only request information directly from businesses when it cannot be obtained from another source, and a substantial amount of data is collected from administrative registers.
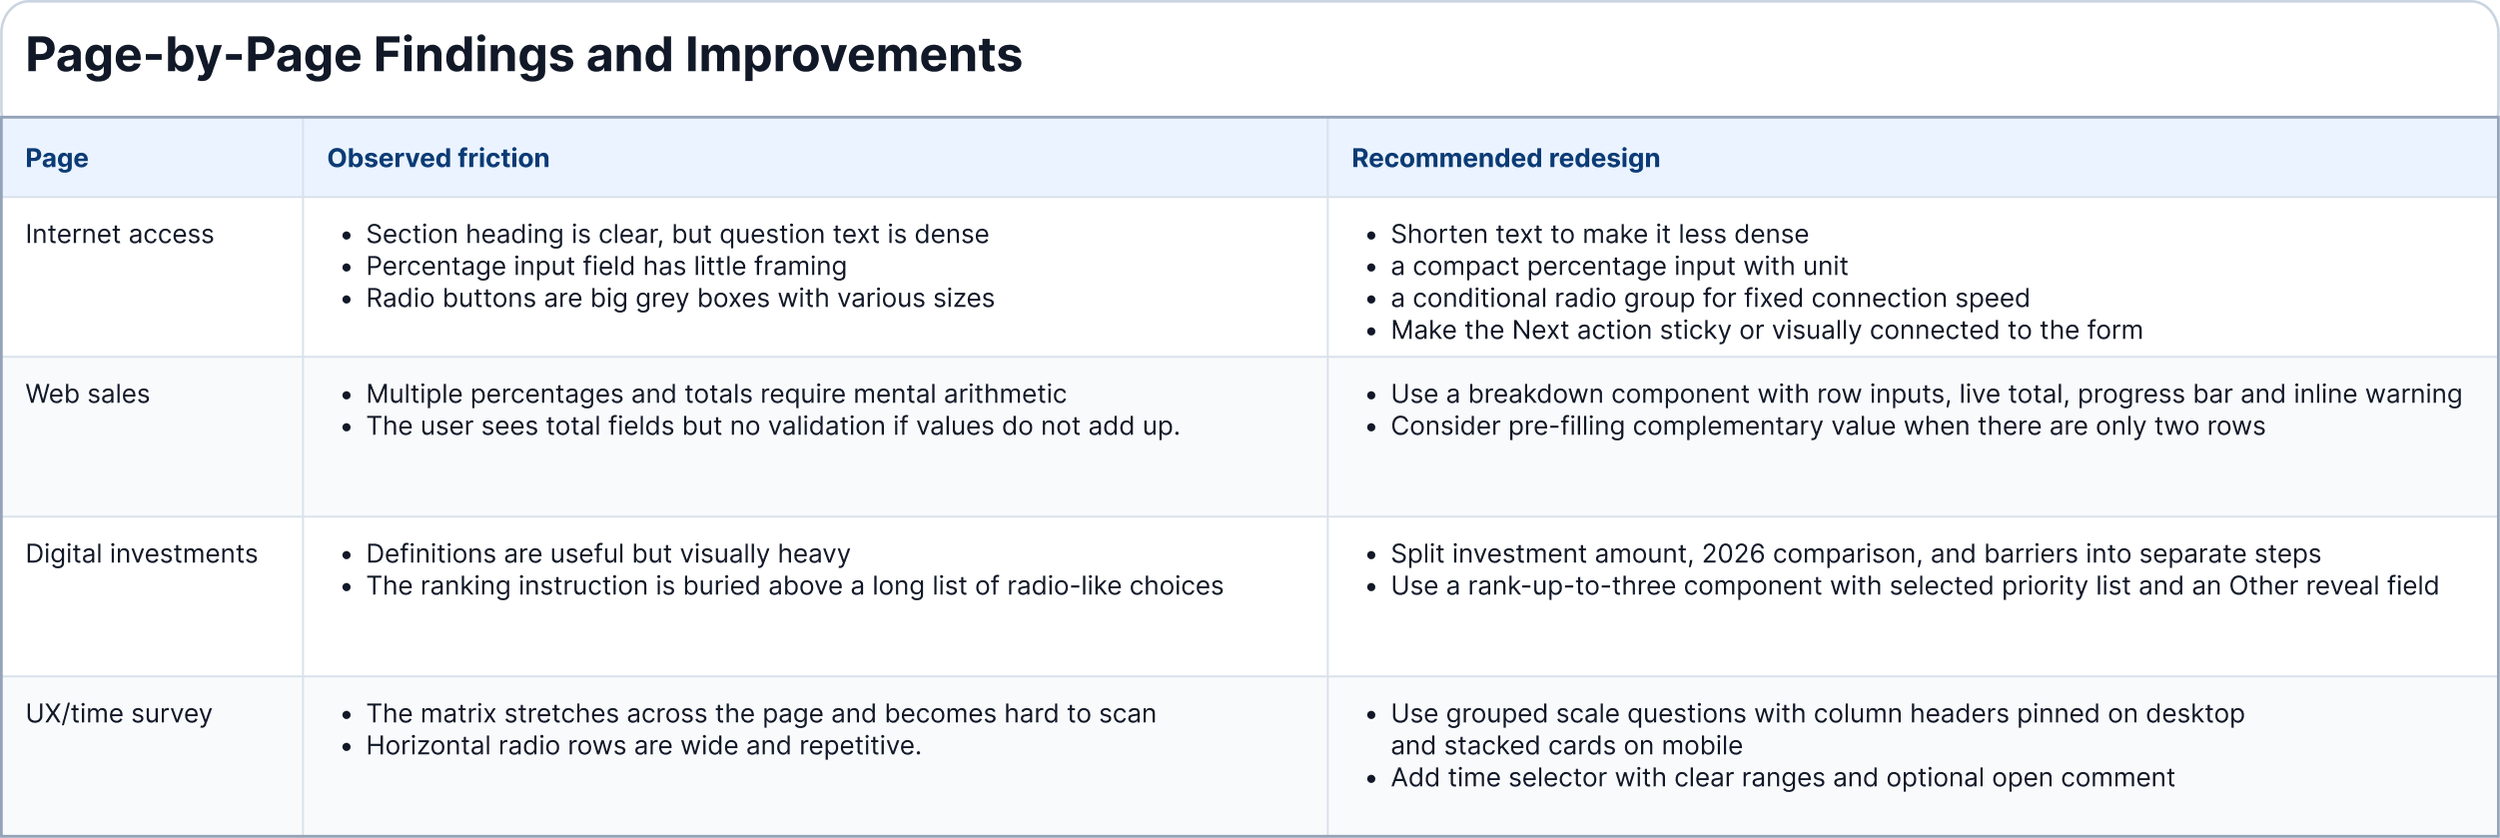
Page-by-Page Findings
The following section shows several pages from Statistics Denmark’s Business Collection surveys, followed by a Page-by-Page Findings and Analysis.
Internet Access
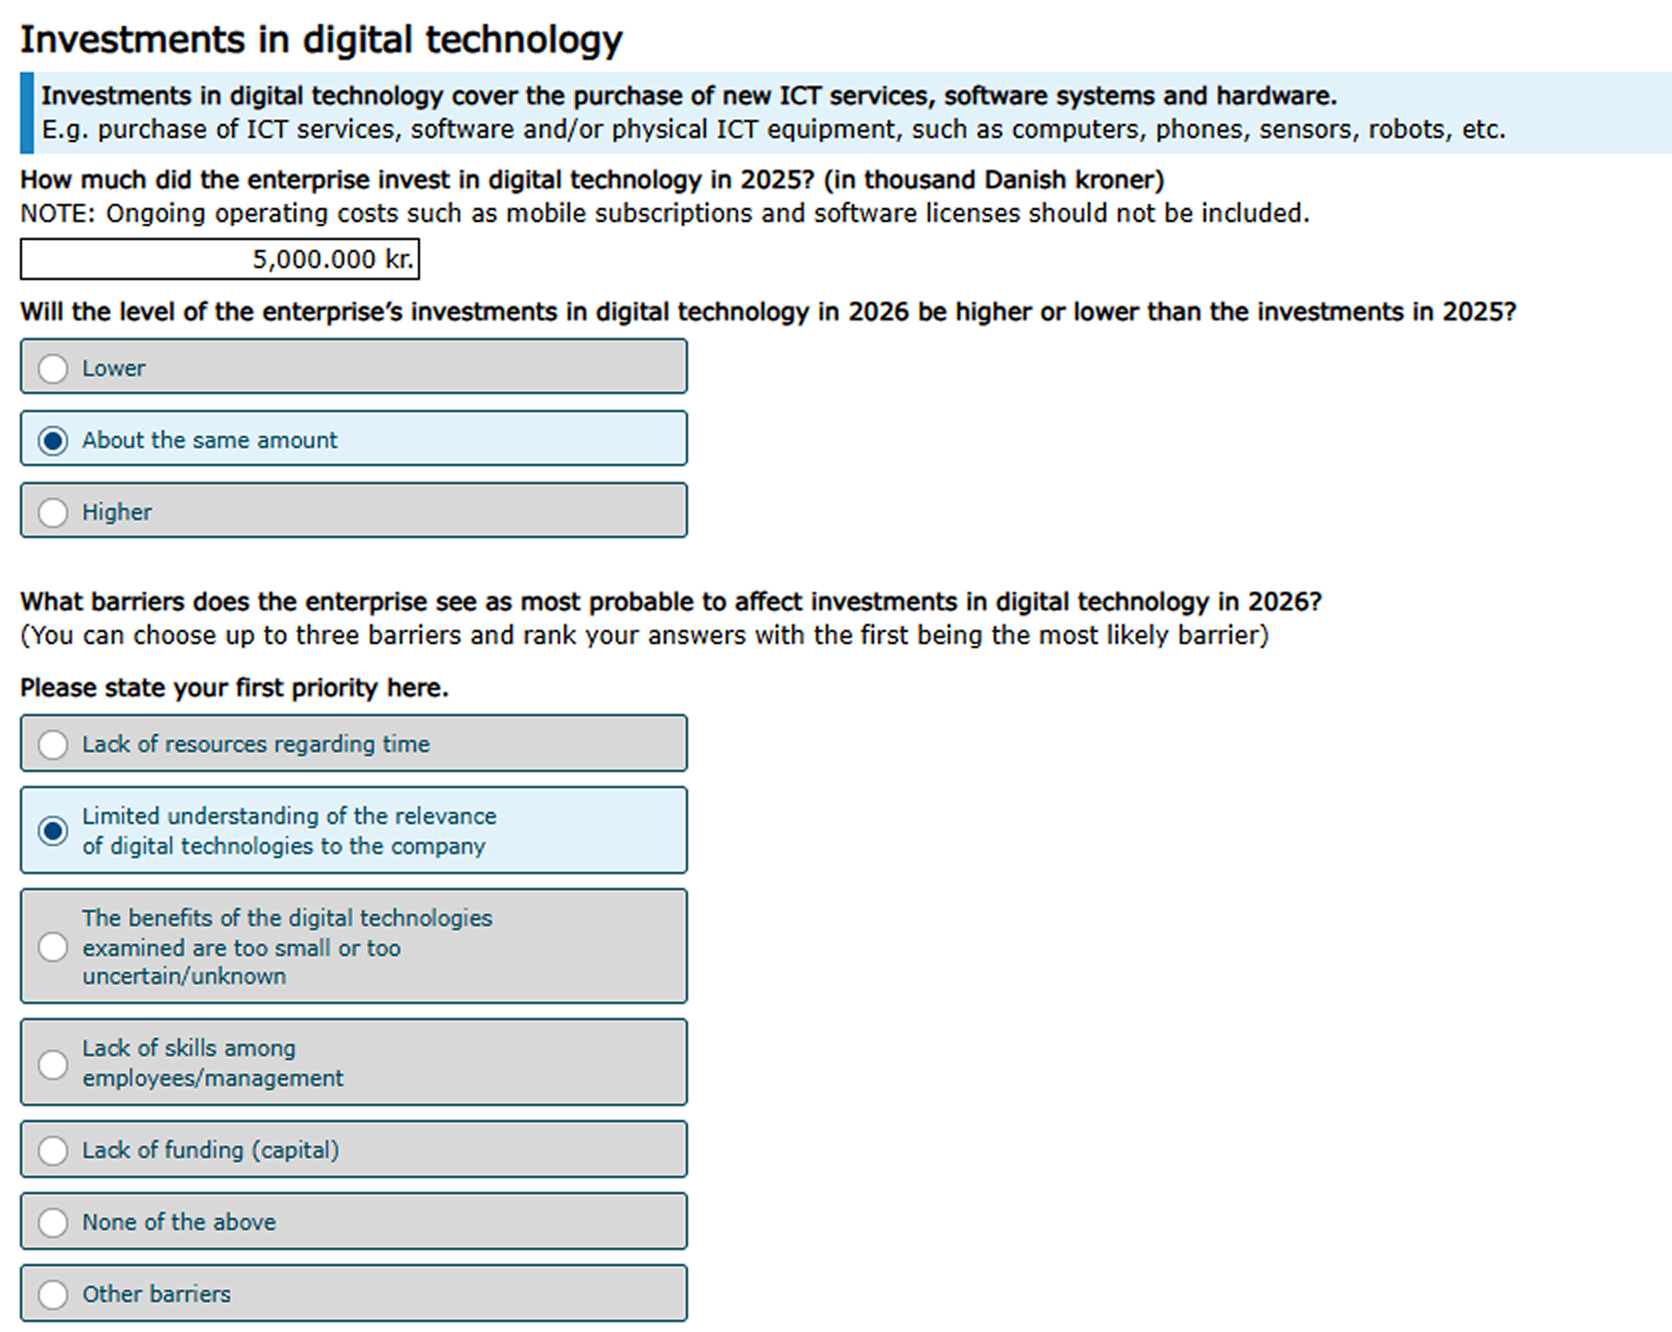
Digital Investments
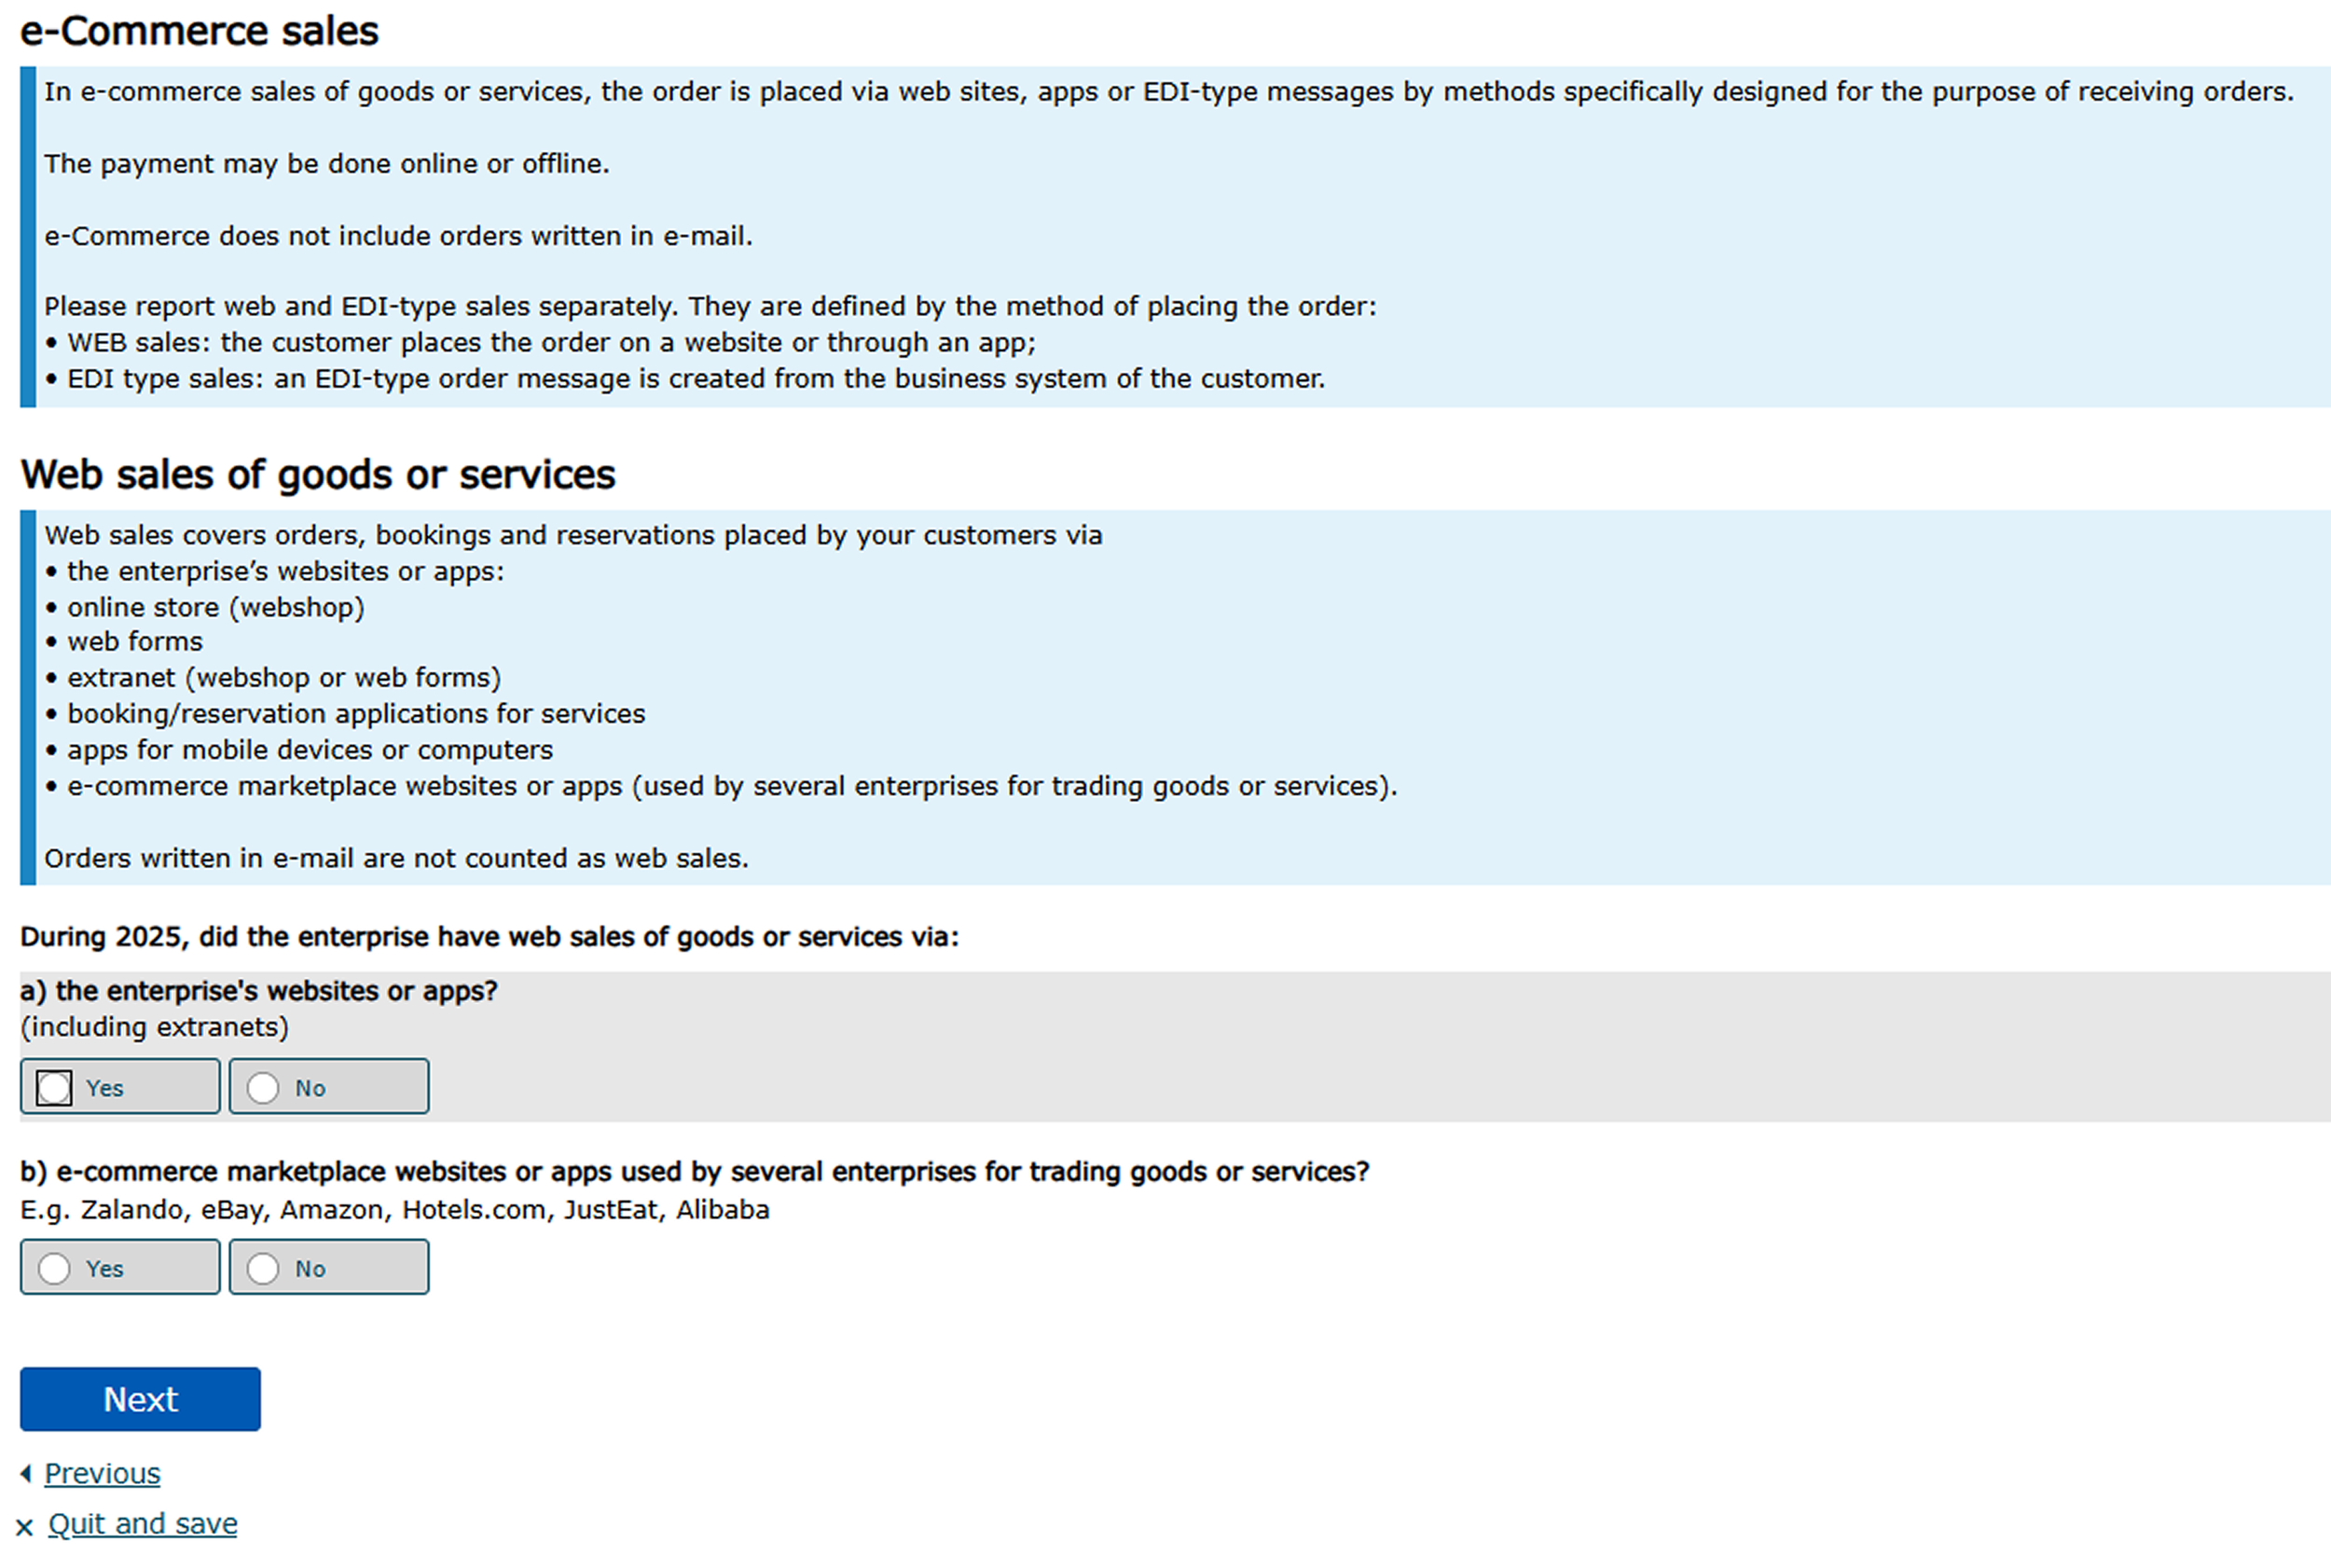
Web Sales
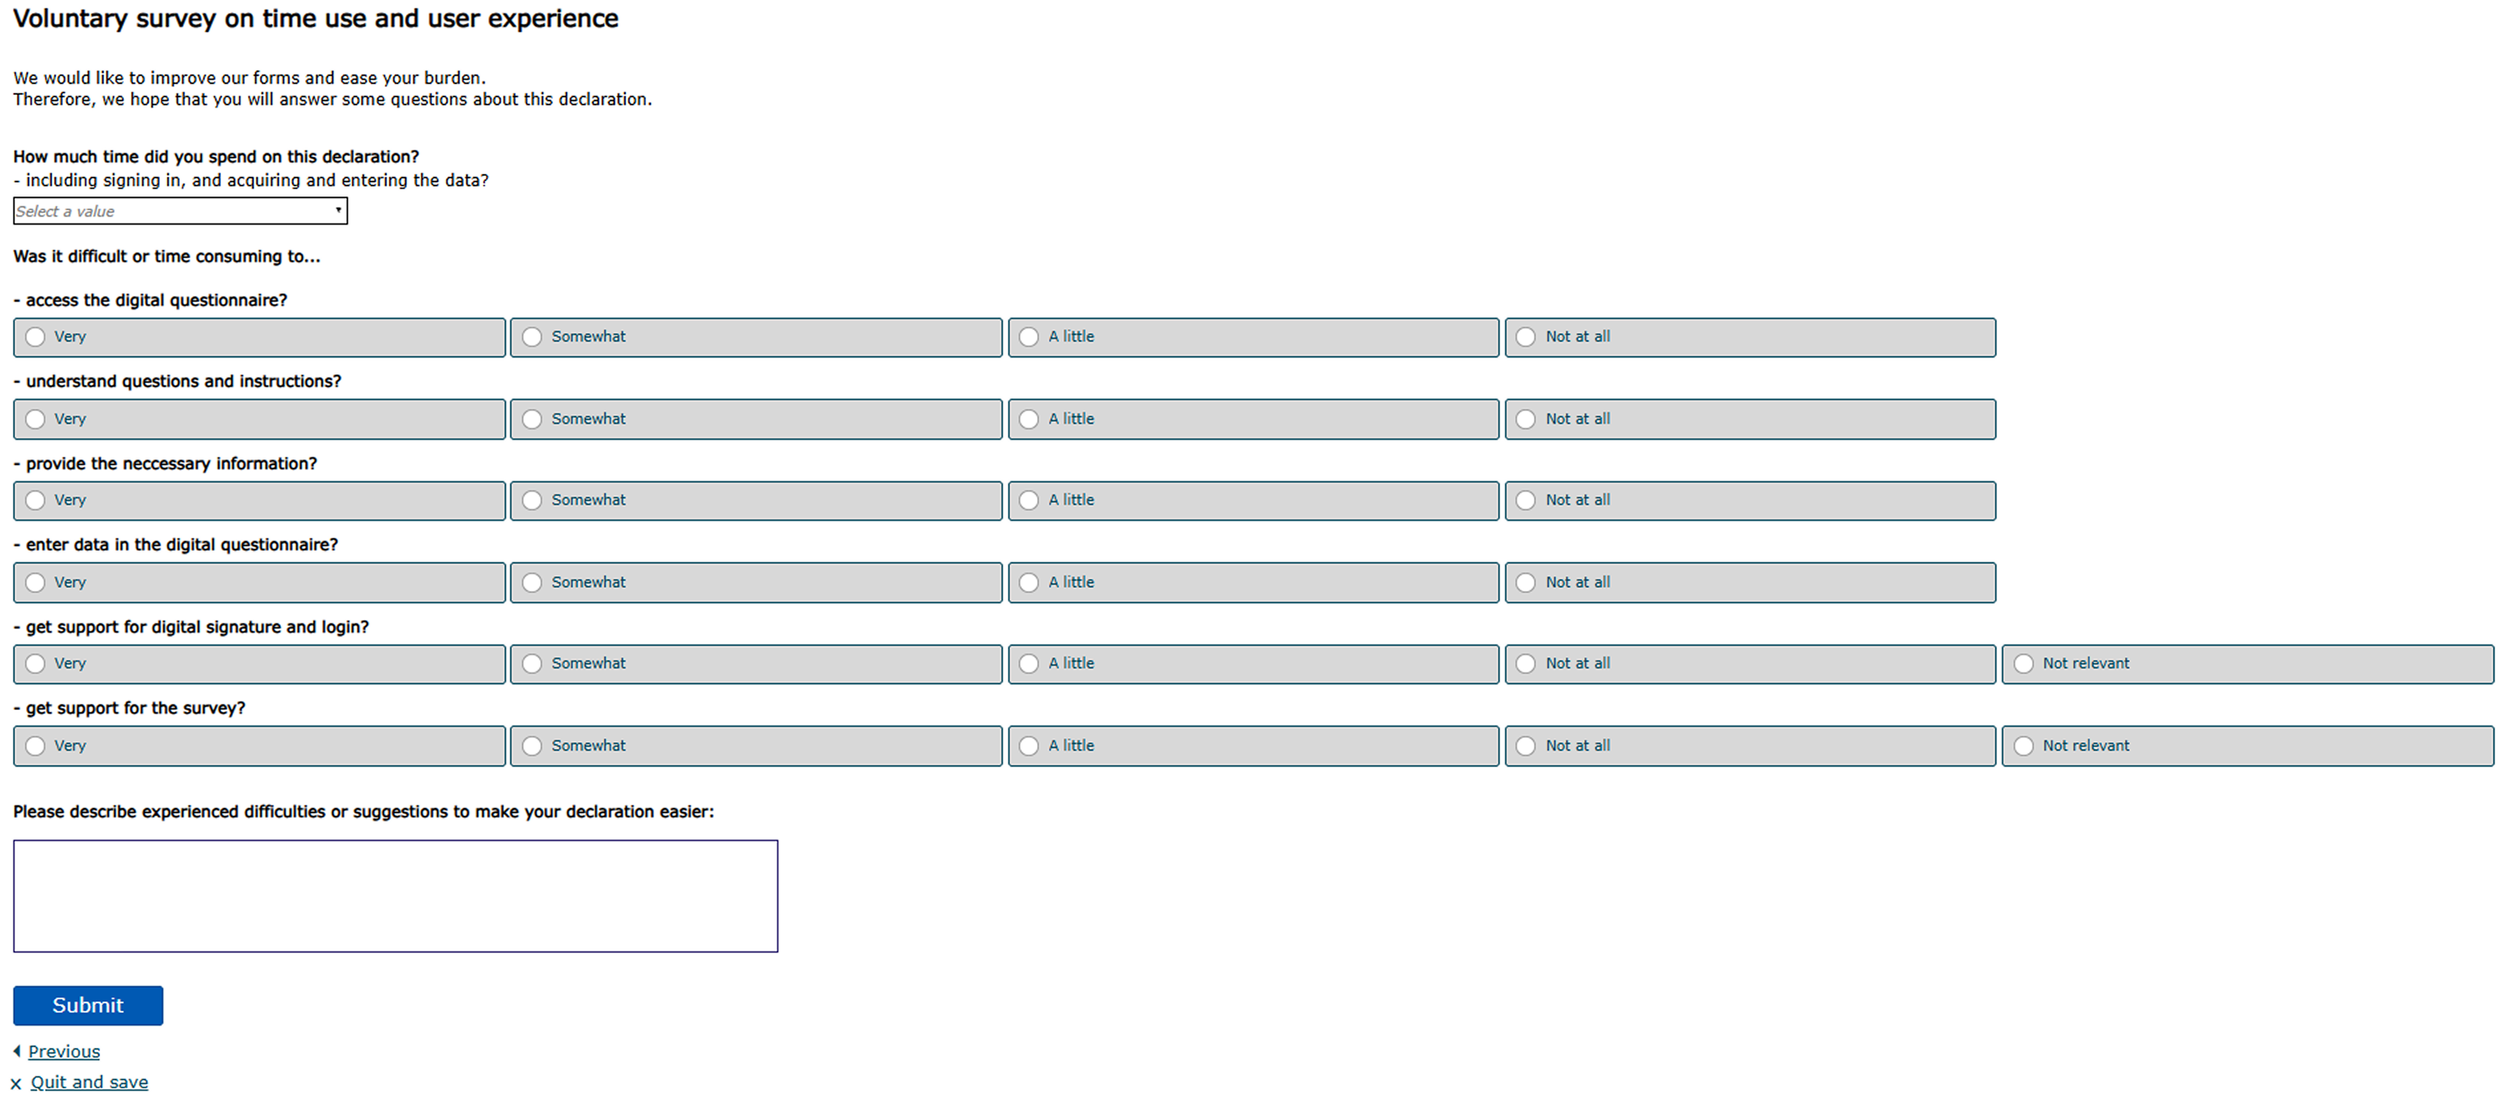
UX Survey
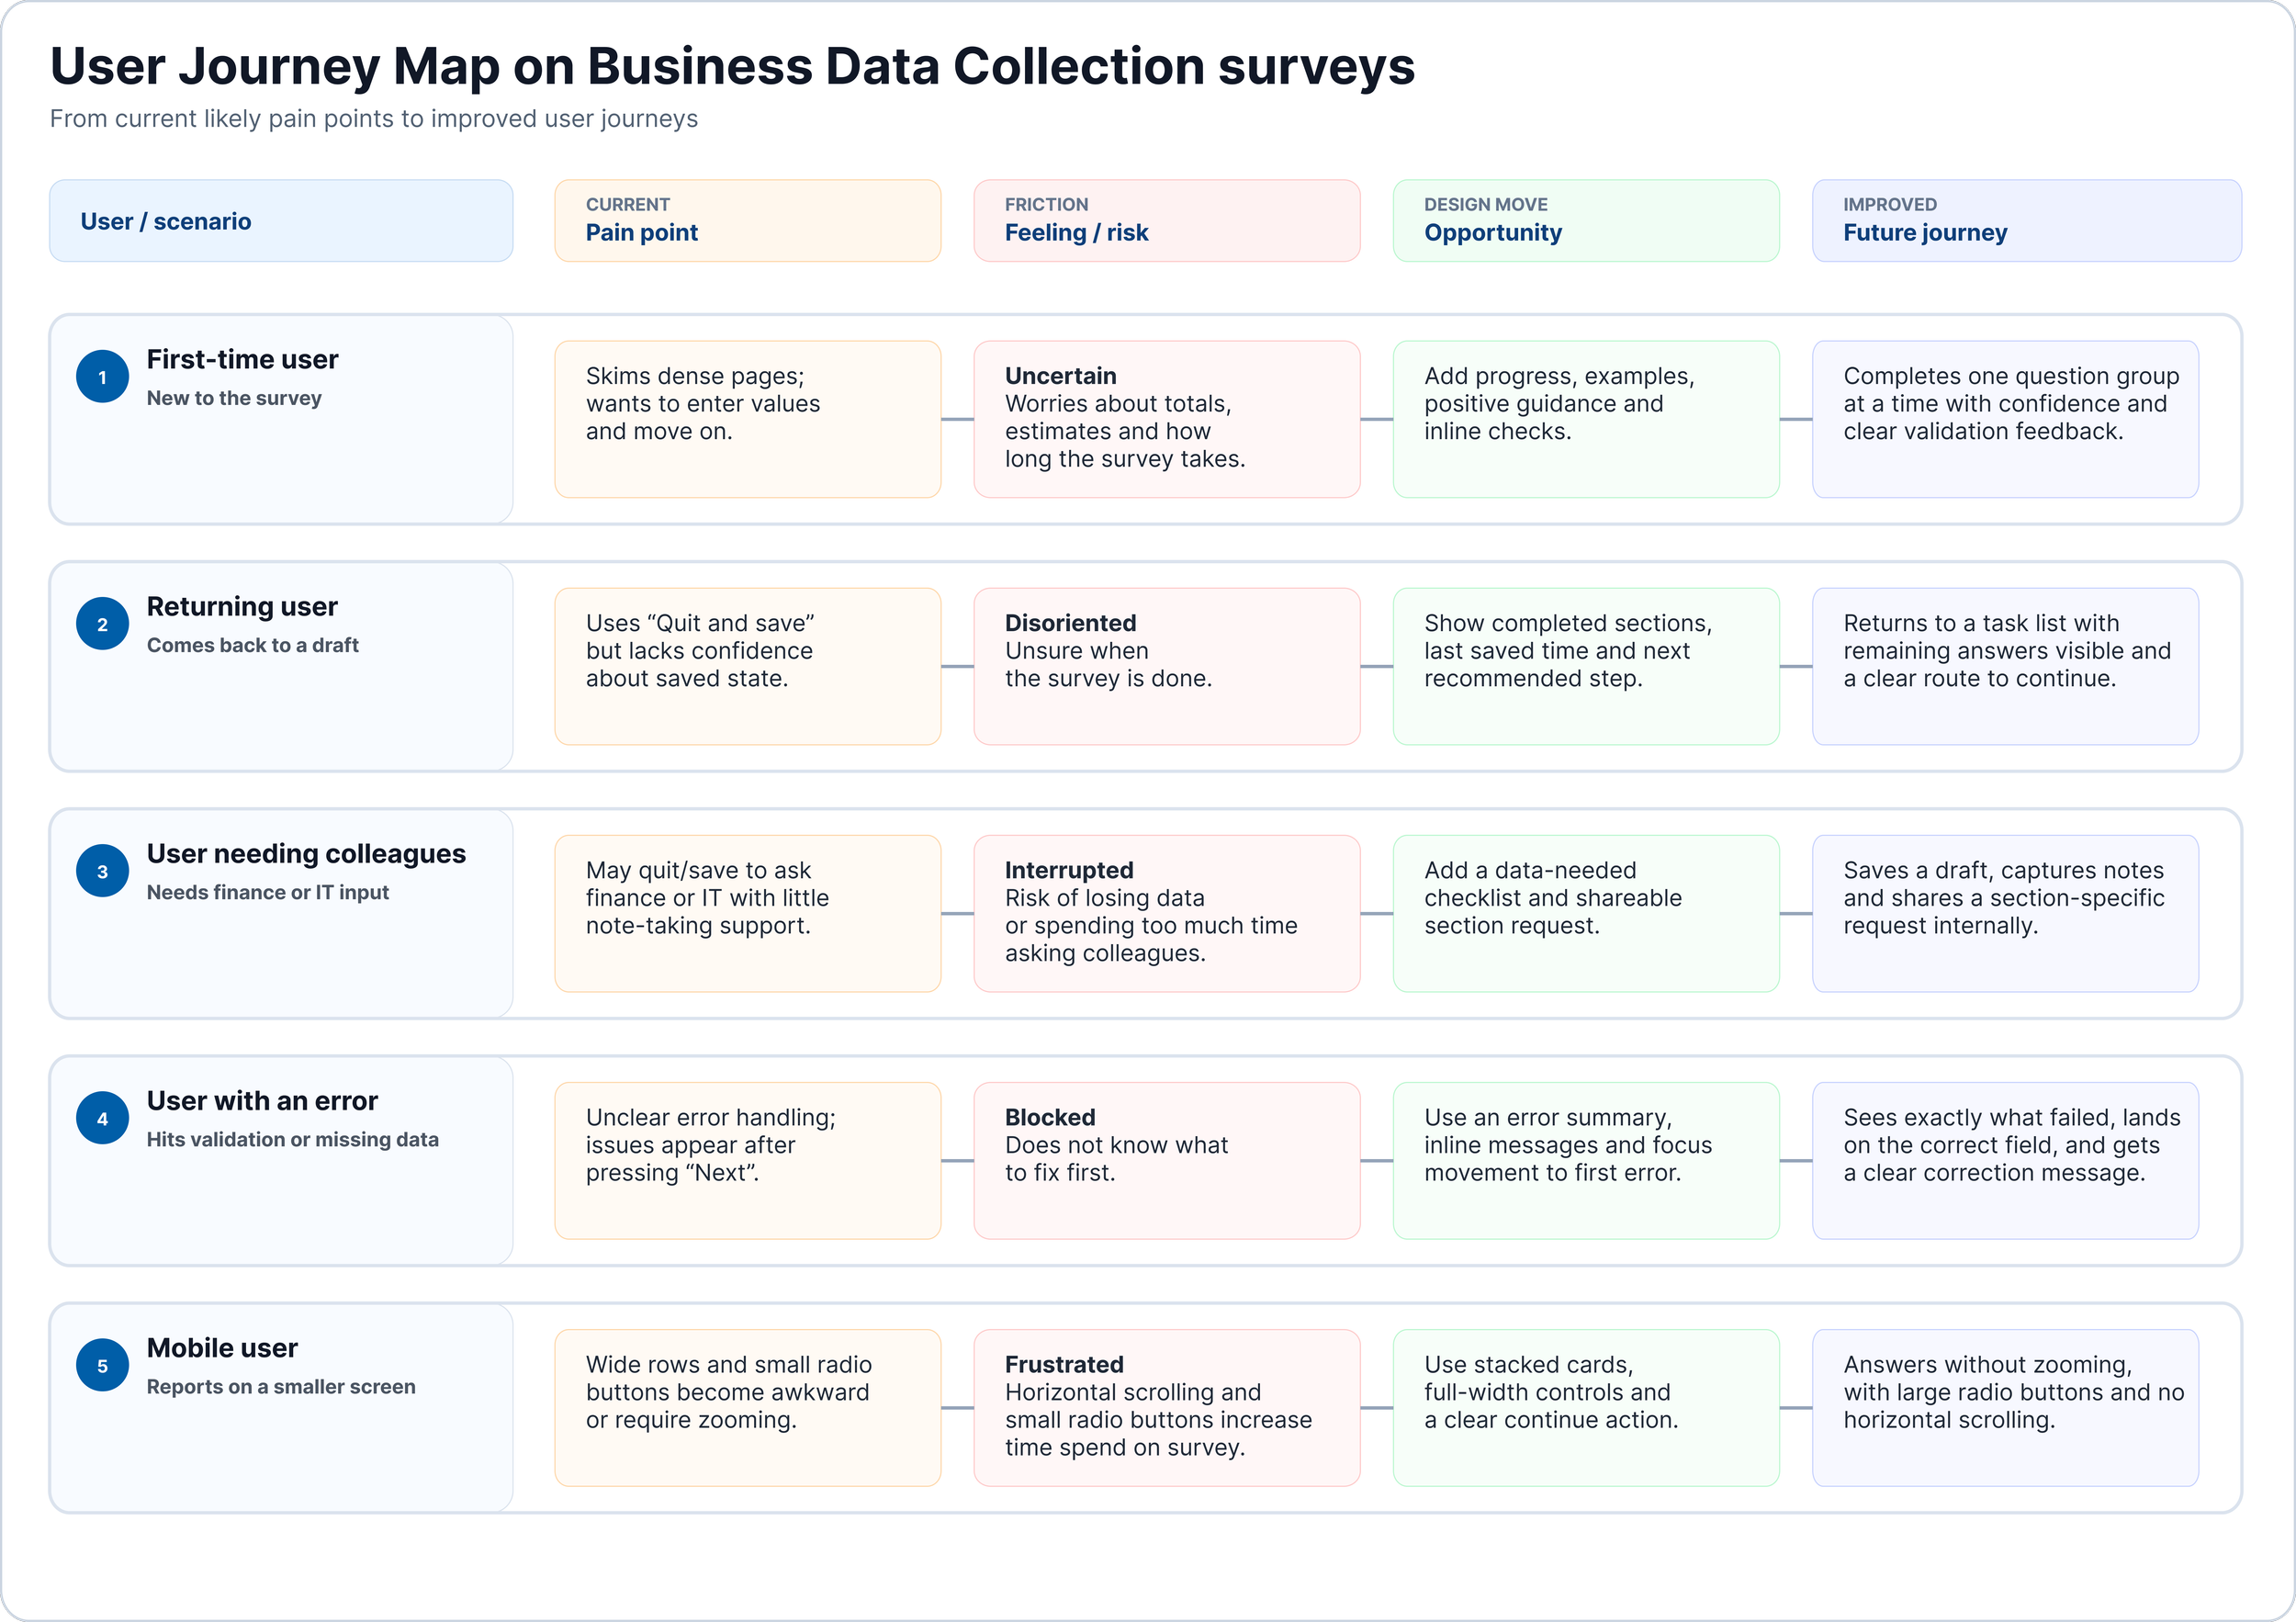
User Journey Map
Alongside the specific Page-by-Page findings, I created a User Journey Map to show the journey of five speicic users of Business Data.
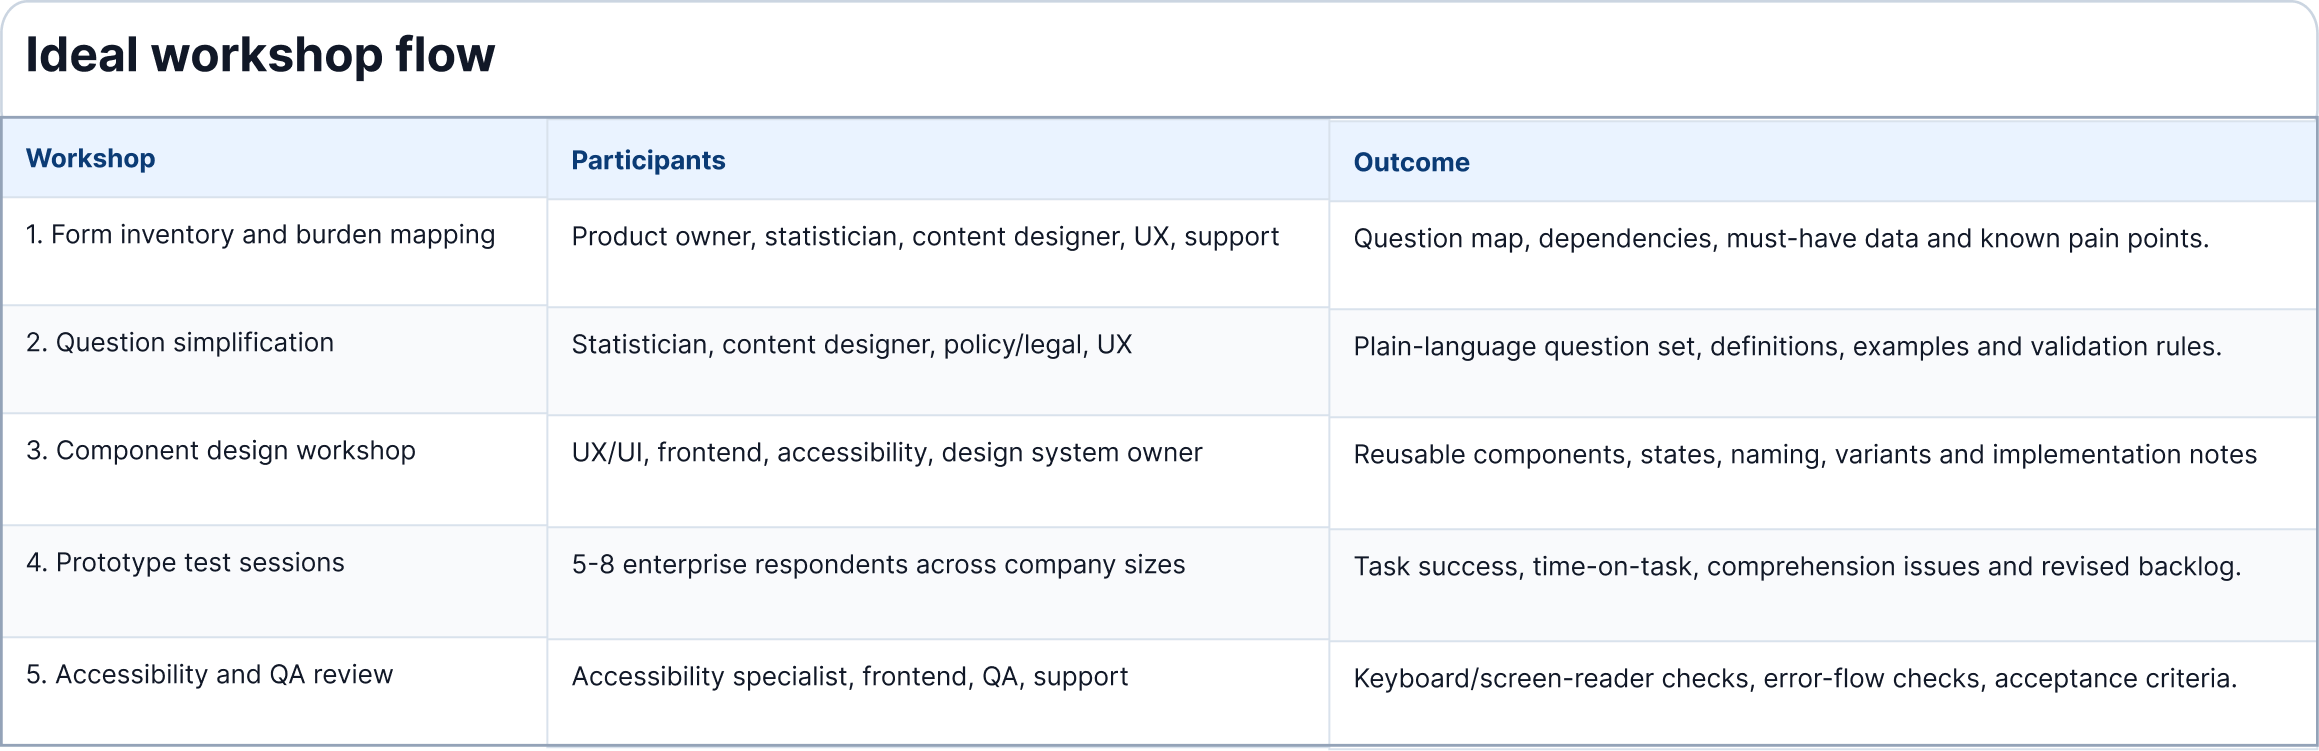
Workshops
To implement the design decisions shown in the User Journey Map, I created an ideal workshop flow.
Prototype
The design choices were implemented in the prototype shown below. Several of the prototypes components were later added to an improved frontend of the business data collection survey.